

THE PUBLIC RECORD / PALORENFIELD NOTES / 09
US hosting employment rose 46.46% in seven years. Before a county claims the next facility, this separates computing infrastructure from construction, concentration from added jobs, and an expansion from a policy success.
489,122
US hosting jobs in Q1 2026
Quarterly average employment. 333,974 in Q1 2019; growth of 46.46%.Q1 2019 to Q1 2026READ THIS WITH THE NUMBER
NAICS 518210 covers computing infrastructure, data processing, web hosting and related services. It isn't a count of data-centre jobs alone.
Analysis by
Paloren Research
What we set out to find.
We compared US government employment records for Q1 2019 and Q1 2026 to find where hosting work grew, then built a local comparison covering 411 reportable counties. We looked at both jobs added and the share of local employment.
What we found
Hosting employment rose from 333,974 to 489,122 jobs, a 46.46% increase. St. Charles County leads on concentration, while Fairfax County added more jobs. The answer to "who gained most?" depends on which measure you choose.
How we did it, and what it cannot tell us ↗Find your place.
Take the evidence.
We've made 411 reportable counties searchable. Start with a name. We keep the count and caveat beside each finding so you can check what you're quoting. A missing place isn't a zero.
Counties
| Rank | Place | Hosting jobs / 10,000 private jobs | Private jobs in denominator |
|---|---|---|---|
| 1 | St. Charles County, MO | 350.53 | 141,442 |
| 2 | San Francisco County, CA | 330.88 | 590,467 |
| 3 | Fairfax County, VA | 299.68 | 537,966 |
| 4 | Ward County, TX | 210.31 | 4,913 |
| 5 | San Mateo County, CA | 168.17 | 380,445 |
| 6 | Santa Clara County, CA | 146.09 | 1,023,933 |
| 7 | Fulton County, GA | 144.29 | 827,876 |
| 8 | King County, WA | 144.25 | 1,240,407 |
| 9 | Travis County, TX | 137.21 | 789,742 |
| 10 | Broomfield County, CO | 128.6 | 39,504 |
| 11 | Laramie County, WY | 125.6 | 34,369 |
| 12 | Houghton County, MI | 121.71 | 9,285 |
| 13 | Laurel County, KY | 119.61 | 23,159 |
| 14 | Denver County, CO | 118.18 | 478,490 |
| 15 | Madison County, MS | 116.14 | 53,755 |
| 16 | St. Joseph County, IN | 113.38 | 108,747 |
| 17 | Boulder County, CO | 107.8 | 153,866 |
| 18 | Utah County, UT | 105.88 | 265,511 |
| 19 | Loudoun County, VA | 104.82 | 172,195 |
| 20 | Hudson County, NJ | 102.35 | 229,082 |
| 21 | Preston County, WV | 100.32 | 5,184 |
| 22 | Alameda County, CA | 98.36 | 666,613 |
| 23 | Collin County, TX | 96.48 | 510,310 |
| 24 | Pecos County, TX | 91.02 | 3,662 |
| 25 | San Juan Municipio, PR | 83.98 | 187,386 |
| 26 | New York County, NY | 81.8 | 2,254,614 |
| 27 | Leon County, FL | 79.47 | 116,150 |
| 28 | Duval County, FL | 78.83 | 501,016 |
| 29 | Arapahoe County, CO | 76.95 | 299,620 |
| 30 | Milwaukee County, WI | 76 | 408,996 |
| 31 | Rock County, WI | 75.24 | 60,783 |
| 32 | Somerset County, NJ | 74.53 | 169,096 |
| 33 | Franklin County, OH | 71.87 | 651,999 |
| 34 | Douglas County, CO | 71.83 | 130,634 |
| 35 | Jackson County, MO | 70.89 | 313,616 |
| 36 | Clark County, WA | 70.11 | 153,136 |
| 37 | York County, SC | 68.44 | 91,860 |
| 38 | St. Louis County, MO | 67.33 | 532,821 |
| 39 | Washtenaw County, MI | 67.16 | 130,923 |
| 40 | Arlington County, VA | 66.63 | 137,335 |
| 41 | Polk County, IA | 65.53 | 273,672 |
| 42 | Montgomery County, TN | 64.12 | 52,401 |
| 43 | Salt Lake County, UT | 63.16 | 685,806 |
| 44 | Delaware County, OH | 60.6 | 89,216 |
| 45 | Suffolk County, MA | 59.79 | 624,032 |
| 46 | Chesapeake city, VA | 59.56 | 89,259 |
| 47 | Warren County, OH | 58.04 | 88,276 |
| 48 | Dane County, WI | 57.64 | 277,220 |
| 49 | Catawba County, NC | 57.26 | 78,362 |
| 50 | Thurston County, WA | 56.27 | 84,596 |
| 51 | Williamson County, TN | 56.23 | 136,632 |
| 52 | Broward County, FL | 54.13 | 746,503 |
| 53 | Seminole County, FL | 53.16 | 194,628 |
| 54 | Gwinnett County, GA | 52.76 | 344,104 |
| 55 | Wake County, NC | 52.46 | 577,747 |
| 56 | Chester County, PA | 51.74 | 225,495 |
| 57 | Washington County, OR | 51.59 | 269,741 |
| 58 | Linn County, IA | 51.16 | 111,474 |
| 59 | Albany County, NY | 50.87 | 167,481 |
| 60 | Hennepin County, MN | 50.81 | 807,567 |
| 61 | Broome County, NY | 49.8 | 64,392 |
| 62 | Multnomah County, OR | 48.67 | 405,482 |
| 63 | Cobb County, GA | 48.63 | 341,506 |
| 64 | Rockingham County, NH | 47.29 | 138,235 |
| 65 | Franklin County, KY | 46.66 | 20,788 |
| 66 | Cook County, IL | 46.01 | 2,249,297 |
| 67 | Champaign County, IL | 45.89 | 65,232 |
| 68 | Hillsborough County, FL | 45.49 | 707,002 |
| 69 | Davidson County, TN | 44.66 | 486,862 |
| 70 | Berkeley County, SC | 44.63 | 61,099 |
| 71 | Maricopa County, AZ | 43.37 | 2,071,076 |
| 72 | DeKalb County, GA | 43.33 | 265,645 |
| 73 | Dallas County, TX | 41.82 | 1,624,630 |
| 74 | Bergen County, NJ | 41.26 | 382,807 |
| 75 | Montgomery County, PA | 41.22 | 464,445 |
| 76 | Bexar County, TX | 39.32 | 770,183 |
| 77 | Sumner County, TN | 38.9 | 54,241 |
| 78 | District of Columbia, DC | 38.89 | 505,816 |
| 79 | Ellis County, TX | 38.72 | 56,220 |
| 80 | Platte County, MO | 38.37 | 42,823 |
| 81 | Frederick County, MD | 37.83 | 85,300 |
| 82 | Johnson County, KS | 37.42 | 337,758 |
| 83 | Pinellas County, FL | 37.08 | 396,230 |
| 84 | East Baton Rouge Parish, LA | 36.17 | 223,374 |
| 85 | Anderson County, TX | 36.13 | 15,499 |
| 86 | Montgomery County, MD | 35.63 | 352,829 |
| 87 | Mecklenburg County, NC | 35.61 | 710,490 |
| 88 | Ouachita Parish, LA | 34.47 | 58,982 |
| 89 | Northampton County, PA | 34.43 | 108,438 |
| 90 | La Plata County, CO | 34.24 | 21,124 |
| 91 | Washington County, MD | 33.94 | 58,134 |
| 92 | Cheatham County, TN | 33.81 | 8,281 |
| 93 | Hughes County, SD | 32.95 | 6,779 |
| 94 | Washoe County, NV | 32.91 | 211,156 |
| 95 | Middlesex County, MA | 32.41 | 787,064 |
| 96 | Cuyahoga County, OH | 32.3 | 587,087 |
| 97 | Denton County, TX | 31.66 | 269,985 |
| 98 | Lewis and Clark County, MT | 31.39 | 28,561 |
| 99 | Clackamas County, OR | 31.35 | 155,782 |
| 100 | Caddo Parish, LA | 31.24 | 92,409 |
| 101 | Sandoval County, NM | 31.16 | 25,563 |
| 102 | Hamilton County, TN | 30.3 | 194,143 |
| 103 | Prince William County, VA | 30.01 | 113,081 |
| 104 | Norfolk County, MA | 29.57 | 302,889 |
| 105 | El Paso County, TX | 28.71 | 269,636 |
| 106 | Montgomery County, AL | 28.51 | 95,181 |
| 107 | Larimer County, CO | 28.44 | 133,123 |
| 108 | Ventura County, CA | 28.22 | 286,014 |
| 109 | Oakland County, MI | 27.98 | 657,166 |
| 110 | Georgetown County, SC | 27.95 | 19,797 |
| 111 | Blaine County, ID | 27.77 | 12,722 |
| 112 | Hillsborough County, NH | 27.53 | 174,506 |
| 113 | Benton County, AR | 27.32 | 139,922 |
| 114 | Erie County, NY | 27.16 | 386,473 |
| 115 | Hamilton County, OH | 26.99 | 449,098 |
| 116 | Chittenden County, VT | 26.61 | 83,916 |
| 117 | Madison County, ID | 26.45 | 14,743 |
| 118 | El Dorado County, CA | 26.44 | 46,894 |
| 119 | Jefferson County, KY | 26.38 | 429,100 |
| 120 | Charleston County, SC | 26.34 | 232,633 |
| 121 | Allegheny County, PA | 25.97 | 596,722 |
| 122 | Orleans Parish, LA | 25.88 | 158,546 |
| 123 | Summit County, UT | 25.37 | 32,453 |
| 124 | Elbert County, CO | 25.37 | 3,811 |
| 125 | Alexandria city, VA | 25.28 | 61,189 |
| 126 | Licking County, OH | 25.07 | 67,941 |
| 127 | Geauga County, OH | 24.91 | 32,382 |
| 128 | Marion County, IN | 24.85 | 531,806 |
| 129 | Jefferson Parish, LA | 24.65 | 169,156 |
| 130 | Los Angeles County, CA | 24.49 | 3,931,147 |
| 131 | Dakota County, MN | 24.4 | 159,854 |
| 132 | Jefferson County, CO | 24.39 | 205,841 |
| 133 | Grand Traverse County, MI | 24.25 | 45,644 |
| 134 | Anne Arundel County, MD | 23.84 | 237,647 |
| 135 | Douglas County, NE | 23.51 | 293,378 |
| 136 | Middlesex County, NJ | 23.49 | 371,758 |
| 137 | Cumberland County, ME | 23.45 | 169,973 |
| 138 | Palm Beach County, FL | 23.34 | 608,212 |
| 139 | Fayette County, KY | 23.1 | 160,438 |
| 140 | Bonner County, ID | 23.03 | 13,462 |
| 141 | Waukesha County, WI | 22.9 | 229,067 |
| 142 | Mahoning County, OH | 22.02 | 78,098 |
| 143 | Kitsap County, WA | 21.93 | 58,672 |
| 144 | Shawnee County, KS | 21.63 | 80,293 |
| 145 | Greene County, MO | 21.52 | 159,709 |
| 146 | Bristol County, RI | 21.43 | 12,442 |
| 147 | Howard County, MD | 21.37 | 150,844 |
| 148 | Ada County, ID | 21.23 | 255,498 |
| 149 | Indian River County, FL | 20.92 | 52,433 |
| 150 | Calvert County, MD | 20.85 | 17,262 |
| 151 | Clark County, NV | 20.78 | 1,026,201 |
| 152 | Henrico County, VA | 20.76 | 168,426 |
| 153 | Hamilton County, IN | 20.51 | 153,583 |
| 154 | Bucks County, PA | 20.5 | 247,015 |
| 155 | Ingham County, MI | 20.42 | 105,943 |
| 156 | Washington County, UT | 20.29 | 80,184 |
| 157 | Nassau County, NY | 20.2 | 546,943 |
| 158 | Lancaster County, NE | 20.15 | 138,984 |
| 159 | San Diego County, CA | 19.98 | 1,286,555 |
| 160 | Oklahoma County, OK | 19.94 | 415,606 |
| 161 | Greene County, OH | 19.75 | 56,023 |
| 162 | Orange County, FL | 19.6 | 874,739 |
| 163 | El Paso County, CO | 19.59 | 249,946 |
| 164 | Contra Costa County, CA | 19.3 | 323,784 |
| 165 | DuPage County, IL | 19.24 | 565,451 |
| 166 | Buncombe County, NC | 19.22 | 118,631 |
| 167 | Suffolk County, NY | 19.06 | 565,025 |
| 168 | Kent County, MI | 18.81 | 387,970 |
| 169 | Spokane County, WA | 18.48 | 202,164 |
| 170 | Prince George's County, MD | 18.09 | 225,746 |
| 171 | Santa Barbara County, CA | 17.99 | 170,605 |
| 172 | Hancock County, WV | 17.83 | 6,919 |
| 173 | Deschutes County, OR | 17.81 | 80,864 |
| 174 | Virginia Beach city, VA | 17.79 | 151,025 |
| 175 | Mercer County, NJ | 17.73 | 182,144 |
| 176 | Sacramento County, CA | 17.71 | 535,063 |
| 177 | Cumberland County, PA | 17.52 | 122,931 |
| 178 | Summit County, OH | 17.44 | 227,253 |
| 179 | Essex County, NJ | 17.39 | 282,394 |
| 180 | Miami-Dade County, FL | 17.37 | 1,138,158 |
| 181 | Williamson County, TX | 17.05 | 212,073 |
| 182 | New Hanover County, NC | 17.04 | 117,760 |
| 183 | Wayne County, MI | 17.02 | 632,489 |
| 184 | Montgomery County, TX | 16.9 | 202,187 |
| 185 | Sangamon County, IL | 16.75 | 73,820 |
| 186 | Marin County, CA | 16.62 | 93,076 |
| 187 | Hernando County, FL | 16.55 | 44,097 |
| 188 | St. Tammany Parish, LA | 15.99 | 82,783 |
| 189 | Orange County, CA | 15.93 | 1,492,067 |
| 190 | Whatcom County, WA | 15.9 | 76,331 |
| 191 | Onondaga County, NY | 15.73 | 204,048 |
| 192 | Santa Fe County, NM | 15.59 | 45,957 |
| 193 | Greenville County, SC | 15.52 | 268,947 |
| 194 | Sierra County, NM | 15.49 | 2,583 |
| 195 | Houston County, TX | 15.44 | 5,830 |
| 196 | Ramsey County, MN | 15.28 | 265,871 |
| 197 | Pulaski County, AR | 15.17 | 209,192 |
| 198 | St. Louis city, MO | 15.04 | 191,450 |
| 199 | Missoula County, MT | 15.04 | 55,196 |
| 200 | Plymouth County, MA | 14.87 | 160,718 |
| 201 | Snohomish County, WA | 14.73 | 257,311 |
| 202 | Coconino County, AZ | 14.35 | 49,464 |
| 203 | Washington County, AR | 14.35 | 101,040 |
| 204 | Cabarrus County, NC | 14.15 | 75,615 |
| 205 | Monroe County, NY | 14.06 | 332,825 |
| 206 | Black Hawk County, IA | 14.02 | 60,138 |
| 207 | Shelby County, AL | 13.96 | 75,433 |
| 208 | Kings County, NY | 13.83 | 797,293 |
| 209 | Union County, NC | 13.7 | 67,168 |
| 210 | Chesterfield County, VA | 13.68 | 123,554 |
| 211 | Sarasota County, FL | 13.67 | 180,407 |
| 212 | Orange County, NY | 13.67 | 126,823 |
| 213 | Tarrant County, TX | 13.65 | 898,694 |
| 214 | Charles County, MD | 13.64 | 31,041 |
| 215 | Minnehaha County, SD | 13.57 | 125,038 |
| 216 | Rabun County, GA | 13.26 | 4,777 |
| 217 | Centre County, PA | 13.18 | 45,772 |
| 218 | San Juan County, WA | 13.16 | 4,561 |
| 219 | Bernalillo County, NM | 13.15 | 279,012 |
| 220 | Walworth County, WI | 13.09 | 37,956 |
| 221 | Monmouth County, NJ | 13.07 | 235,328 |
| 222 | Luzerne County, PA | 13.02 | 126,959 |
| 223 | Gallatin County, MT | 13.01 | 66,620 |
| 224 | Guilford County, NC | 12.95 | 256,893 |
| 225 | Oldham County, KY | 12.83 | 13,768 |
| 226 | Rockland County, NY | 12.82 | 117,486 |
| 227 | Clay County, SD | 12.82 | 3,640 |
| 228 | Morris County, NJ | 12.69 | 267,963 |
| 229 | Durham County, NC | 12.58 | 208,481 |
| 230 | McLennan County, TX | 12.56 | 101,916 |
| 231 | Chatham County, NC | 12.48 | 17,367 |
| 232 | Alachua County, FL | 12.37 | 103,228 |
| 233 | Harris County, TX | 12.24 | 2,149,352 |
| 234 | New Castle County, DE | 12.14 | 264,229 |
| 235 | Brookings County, SD | 12.11 | 14,868 |
| 236 | Worcester County, MA | 12.07 | 295,764 |
| 237 | Philadelphia County, PA | 12.01 | 614,091 |
| 238 | Manatee County, FL | 11.9 | 134,202 |
| 239 | Burlington County, NJ | 11.77 | 188,364 |
| 240 | Mobile County, AL | 11.62 | 149,442 |
| 241 | Johnson County, IN | 11.39 | 58,231 |
| 242 | Honolulu County, HI | 11.25 | 360,526 |
| 243 | Tulsa County, OK | 11.19 | 335,707 |
| 244 | Baltimore County, MD | 11.16 | 309,819 |
| 245 | Westchester County, NY | 11.09 | 359,751 |
| 246 | Hardin County, KY | 11.08 | 37,622 |
| 247 | Johnson County, IA | 11.06 | 50,651 |
| 248 | Jefferson County, AL | 11.05 | 301,954 |
| 249 | Forsyth County, NC | 11.05 | 171,401 |
| 250 | Kent County, RI | 10.94 | 67,666 |
| 251 | Clay County, MO | 10.92 | 92,504 |
| 252 | Klickitat County, WA | 10.84 | 4,613 |
| 253 | Skagit County, WA | 10.58 | 40,025 |
| 254 | Walton County, FL | 10.2 | 30,705 |
| 255 | Roosevelt County, NM | 10.11 | 3,955 |
| 256 | Hanover County, VA | 9.98 | 50,775 |
| 257 | Washington County, VT | 9.83 | 24,766 |
| 258 | Fort Bend County, TX | 9.74 | 214,597 |
| 259 | Richland County, SC | 9.68 | 174,280 |
| 260 | Newport County, RI | 9.62 | 32,228 |
| 261 | Dallas County, IA | 9.56 | 50,232 |
| 262 | Lucas County, OH | 9.5 | 163,479 |
| 263 | Pima County, AZ | 9.47 | 311,450 |
| 264 | Douglas County, NV | 9.47 | 19,005 |
| 265 | Beaufort County, SC | 9.44 | 60,380 |
| 266 | Cass County, ND | 9.38 | 111,268 |
| 267 | Essex County, MA | 9.38 | 276,239 |
| 268 | Martin County, FL | 9.25 | 73,483 |
| 269 | Columbia County, GA | 9.09 | 37,776 |
| 270 | Bedford County, VA | 9.08 | 15,420 |
| 271 | Iredell County, NC | 9.06 | 70,992 |
| 272 | Carson City, NV | 9.05 | 22,844 |
| 273 | Providence County, RI | 8.96 | 249,241 |
| 274 | Dorchester County, SC | 8.91 | 33,681 |
| 275 | Lee County, FL | 8.88 | 275,100 |
| 276 | Grafton County, NH | 8.8 | 48,116 |
| 277 | Johnston County, NC | 8.77 | 57,039 |
| 278 | Sedgwick County, KS | 8.72 | 233,196 |
| 279 | Sussex County, DE | 8.58 | 81,939 |
| 280 | Orange County, VT | 8.53 | 5,471 |
| 281 | Berkshire County, MA | 8.41 | 48,380 |
| 282 | Shelby County, TN | 8.36 | 400,321 |
| 283 | Williams County, ND | 8.35 | 23,165 |
| 284 | Winchester city, VA | 8.34 | 21,980 |
| 285 | Putnam County, NY | 8.24 | 21,442 |
| 286 | Berks County, PA | 8.24 | 152,995 |
| 287 | Solano County, CA | 8.16 | 118,891 |
| 288 | Hampton city, VA | 8.1 | 34,574 |
| 289 | Adams County, CO | 8.05 | 197,212 |
| 290 | Berkeley County, WV | 7.95 | 29,347 |
| 291 | Dauphin County, PA | 7.87 | 149,171 |
| 292 | Brevard County, FL | 7.82 | 215,979 |
| 293 | Collier County, FL | 7.71 | 161,774 |
| 294 | Clermont County, OH | 7.69 | 55,060 |
| 295 | Teton County, ID | 7.62 | 3,935 |
| 296 | Weld County, CO | 7.55 | 102,432 |
| 297 | Montgomery County, OH | 7.48 | 217,961 |
| 298 | Rockwall County, TX | 7.45 | 38,503 |
| 299 | Cabell County, WV | 7.43 | 43,043 |
| 300 | Bell County, TX | 7.41 | 99,473 |
| 301 | Anchorage Municipality, AK | 7.41 | 118,829 |
| 302 | Pierce County, WA | 7.32 | 274,235 |
| 303 | Horry County, SC | 7.27 | 121,440 |
| 304 | Fayette County, TN | 7.25 | 6,895 |
| 305 | Pennington County, SD | 7.21 | 53,203 |
| 306 | Cayuga County, NY | 7.15 | 18,641 |
| 307 | Pasco County, FL | 7.09 | 133,004 |
| 308 | Ottawa County, MI | 7.04 | 110,326 |
| 309 | Mesa County, CO | 7.01 | 55,596 |
| 310 | Hays County, TX | 6.95 | 82,437 |
| 311 | St. Louis County, MN | 6.95 | 78,141 |
| 312 | Portage County, OH | 6.91 | 45,357 |
| 313 | Carbon County, WY | 6.89 | 4,354 |
| 314 | Baltimore city, MD | 6.89 | 264,312 |
| 315 | Windham County, VT | 6.82 | 18,566 |
| 316 | Uinta County, WY | 6.8 | 5,887 |
| 317 | Wilson County, TN | 6.71 | 59,613 |
| 318 | Dale County, AL | 6.69 | 12,464 |
| 319 | Marion County, FL | 6.51 | 106,564 |
| 320 | Jefferson County, ID | 6.5 | 6,663 |
| 321 | Kenton County, KY | 6.47 | 65,996 |
| 322 | Volusia County, FL | 6.43 | 169,581 |
| 323 | Albany County, WY | 6.38 | 11,502 |
| 324 | Lake County, OH | 6.22 | 87,366 |
| 325 | Genesee County, MI | 6.14 | 114,006 |
| 326 | Curry County, NM | 6.11 | 14,724 |
| 327 | Delaware County, IN | 6.11 | 35,998 |
| 328 | Lake County, IL | 5.68 | 273,626 |
| 329 | Citrus County, FL | 5.66 | 30,648 |
| 330 | Ocean County, NJ | 5.64 | 160,659 |
| 331 | Grand Forks County, ND | 5.6 | 32,120 |
| 332 | Fayette County, WV | 5.52 | 7,241 |
| 333 | Okaloosa County, FL | 5.48 | 71,164 |
| 334 | Kenosha County, WI | 5.44 | 67,447 |
| 335 | Sonoma County, CA | 5.43 | 175,012 |
| 336 | Pickens County, SC | 5.43 | 30,106 |
| 337 | Queens County, NY | 5.33 | 619,026 |
| 338 | Stark County, OH | 5.26 | 136,859 |
| 339 | Talladega County, AL | 5.26 | 26,628 |
| 340 | Marion County, OR | 5.25 | 133,890 |
| 341 | Parker County, TX | 5.11 | 36,505 |
| 342 | Jackson County, OK | 5.06 | 5,931 |
| 343 | Yankton County, SD | 4.95 | 10,764 |
| 344 | Pittsburg County, OK | 4.95 | 8,763 |
| 345 | Transylvania County, NC | 4.91 | 8,151 |
| 346 | Spartanburg County, SC | 4.9 | 140,798 |
| 347 | Lancaster County, PA | 4.89 | 231,741 |
| 348 | San Luis Obispo County, CA | 4.84 | 98,474 |
| 349 | Sherburne County, MN | 4.77 | 23,063 |
| 350 | Carver County, MN | 4.67 | 34,296 |
| 351 | Caldwell County, NC | 4.65 | 21,487 |
| 352 | Livingston Parish, LA | 4.59 | 24,675 |
| 353 | Accomack County, VA | 4.52 | 9,587 |
| 354 | Brown County, SD | 4.52 | 16,241 |
| 355 | Maury County, TN | 4.42 | 33,173 |
| 356 | Macomb County, MI | 4.35 | 293,171 |
| 357 | Clark County, OH | 4.29 | 36,500 |
| 358 | Sheridan County, WY | 4.29 | 10,884 |
| 359 | Allegan County, MI | 4.2 | 38,864 |
| 360 | Hunterdon County, NJ | 4.18 | 39,031 |
| 361 | Benton County, WA | 4.08 | 83,277 |
| 362 | Augusta County, VA | 4.07 | 26,208 |
| 363 | Will County, IL | 4.04 | 231,758 |
| 364 | Delaware County, PA | 4.02 | 192,273 |
| 365 | Lexington County, SC | 4.01 | 112,112 |
| 366 | Madison County, IN | 3.9 | 33,350 |
| 367 | Blount County, TN | 3.88 | 50,746 |
| 368 | Oconee County, GA | 3.72 | 16,137 |
| 369 | Lehigh County, PA | 3.62 | 180,389 |
| 370 | Webster Parish, LA | 3.6 | 9,254 |
| 371 | Onslow County, NC | 3.44 | 39,768 |
| 372 | Calcasieu Parish, LA | 3.4 | 75,448 |
| 373 | Merrimack County, NH | 3.3 | 59,587 |
| 374 | Bradley County, TN | 3.23 | 35,124 |
| 375 | Smith County, TX | 3.22 | 100,360 |
| 376 | York County, VA | 3.17 | 17,879 |
| 377 | Lake County, IN | 3.1 | 167,865 |
| 378 | Polk County, FL | 2.99 | 234,144 |
| 379 | Laurens County, SC | 2.99 | 16,730 |
| 380 | Kanawha County, WV | 2.98 | 75,004 |
| 381 | Marathon County, WI | 2.91 | 60,806 |
| 382 | Wood County, OH | 2.85 | 64,220 |
| 383 | Christian County, KY | 2.85 | 24,590 |
| 384 | Rockingham County, VA | 2.62 | 30,587 |
| 385 | Medina County, OH | 2.56 | 54,636 |
| 386 | St. Mary Parish, LA | 2.55 | 15,708 |
| 387 | Davidson County, NC | 2.48 | 40,323 |
| 388 | Camden County, NJ | 2.46 | 176,030 |
| 389 | Bartholomew County, IN | 2.45 | 42,200 |
| 390 | Beaver County, PA | 2.43 | 41,128 |
| 391 | Boone County, MO | 2.41 | 70,548 |
| 392 | Bannock County, ID | 2.31 | 30,331 |
| 393 | DeKalb County, AL | 2.29 | 18,927 |
| 394 | Anoka County, MN | 2.28 | 113,882 |
| 395 | Knox County, ME | 2.27 | 13,208 |
| 396 | Kane County, IL | 2.15 | 173,520 |
| 397 | Cache County, UT | 2.07 | 51,525 |
| 398 | Westmoreland County, PA | 2.02 | 112,089 |
| 399 | Ohio County, WV | 2 | 23,350 |
| 400 | Wright County, MN | 1.97 | 40,556 |
| 401 | Putnam County, WV | 1.84 | 19,961 |
| 402 | Washington County, OK | 1.82 | 16,520 |
| 403 | Etowah County, AL | 1.81 | 27,612 |
| 404 | Hendricks County, IN | 1.73 | 71,453 |
| 405 | Escambia County, FL | 1.66 | 122,345 |
| 406 | Fairbanks North Star Borough, AK | 1.51 | 26,418 |
| 407 | McHenry County, IL | 1.34 | 79,608 |
| 408 | Fresno County, CA | 1.23 | 348,556 |
| 409 | Lackawanna County, PA | 1.14 | 87,412 |
| 410 | Floyd County, GA | 1.01 | 39,479 |
| 411 | Rankin County, MS | 0.86 | 58,209 |
States
| Rank | Place | Hosting jobs / 10,000 private jobs | Private jobs in denominator |
|---|---|---|---|
| 1 | Virginia | 74.32 | 3,363,622 |
| 2 | Washington | 72.95 | 2,953,353 |
| 3 | Georgia | 60.77 | 4,182,357 |
| 4 | Missouri | 57.92 | 2,456,720 |
| 5 | California | 54.56 | 15,448,934 |
| 6 | Colorado | 53.99 | 2,401,524 |
| 7 | Utah | 52.37 | 1,461,932 |
| 8 | Oregon | 46.51 | 1,648,815 |
| 9 | New Jersey | 43.56 | 3,635,896 |
| 10 | Texas | 39.5 | 12,042,851 |
| 11 | District of Columbia | 38.89 | 505,854 |
| 12 | Arizona | 36.99 | 2,834,020 |
| 13 | New York | 36.11 | 8,248,316 |
| 14 | Arkansas | 34.64 | 1,100,062 |
| 15 | Illinois | 32.89 | 5,141,056 |
| 16 | Massachusetts | 32.73 | 3,098,429 |
| 17 | New Hampshire | 32.42 | 591,145 |
| 18 | Connecticut | 32.37 | 1,439,816 |
| 19 | Puerto Rico | 32.06 | 748,371 |
| 20 | Florida | 31.43 | 8,832,786 |
| 21 | Wisconsin | 31.09 | 2,513,312 |
| 22 | Minnesota | 29.61 | 2,481,308 |
| 23 | North Carolina | 29.06 | 4,211,926 |
| 24 | Ohio | 28.84 | 4,712,501 |
| 25 | Iowa | 28.47 | 1,282,955 |
| 26 | Nebraska | 27.71 | 838,192 |
| 27 | Tennessee | 26.87 | 2,815,630 |
| 28 | Michigan | 26.08 | 3,765,255 |
| 29 | Pennsylvania | 25.87 | 5,302,628 |
| 30 | Wyoming | 25.66 | 206,816 |
| 31 | Maryland | 25.2 | 2,184,528 |
| 32 | Nevada | 23.18 | 1,395,376 |
| 33 | Alabama | 22.66 | 1,722,398 |
| 34 | West Virginia | 22.48 | 554,386 |
| 35 | South Carolina | 21.67 | 1,947,747 |
| 36 | Kentucky | 21.14 | 1,670,307 |
| 37 | Vermont | 19.21 | 251,967 |
| 38 | Kansas | 19.15 | 1,176,205 |
| 39 | Louisiana | 18.13 | 1,611,206 |
| 40 | Indiana | 17.4 | 2,752,757 |
| 41 | Idaho | 16.78 | 740,213 |
| 42 | New Mexico | 15.18 | 681,769 |
| 43 | Rhode Island | 15.17 | 424,542 |
| 44 | Maine | 15.05 | 527,298 |
| 45 | Oklahoma | 12.47 | 1,354,892 |
| 46 | Mississippi | 12.12 | 935,195 |
| 47 | Delaware | 11.4 | 402,427 |
| 48 | Montana | 11.32 | 421,239 |
| 49 | Hawaii | 9.85 | 520,598 |
No reportable match. Try a shorter name or switch geography.
Employment and total private employment must be disclosed in both quarters, with at least 3 hosting establishments in Q1 2026. Growth ranks require at least 100 hosting jobs in Q1 2019.
01
THE FINDING
AND ITS MEANING
St. Charles has the concentration. Fairfax has the larger gain.
St. Charles County, Missouri has 350.53 hosting jobs per 10,000 private jobs, the highest reportable rate. Its 4,958 hosting jobs sit within a private employment base of 141,442.
Fairfax County, Virginia has a lower concentration, 299.68 per 10,000, but a larger hosting workforce of 16,122. Its recorded gain of 10,035.7 quarterly-average jobs compares with 1,800 in St. Charles. The county leading one measure need not lead the other.
The gap between the two measures can come from at least three things: a small specialist economy can produce a high rate while producing few jobs; a large county can absorb a major gain with less visible change in its mix; and employment can move between registered locations without either place adding a job.
We'd ask both questions before crediting a policy, but neither answer alone tells us whether policy worked.
Source records and definitions ↗Concentration is not the number of jobs added
St. Charles County, MO
Hosting jobs / 10,000 private jobs, Q1 2026350.53
Quarterly-average jobs added, Q1 2019 to Q1 2026+1,800
Source: 4,958 hosting jobs / 141,442 private jobs in Q1 2026
Fairfax County, VA
Hosting jobs / 10,000 private jobs, Q1 2026299.68
Quarterly-average jobs added, Q1 2019 to Q1 2026+10,035.7
Source: 16,122 hosting jobs / 537,966 private jobs in Q1 2026
Each column has its own scale. Quarterly averages can be fractional. BLS QCEW, NAICS 518210; preliminary Q1 2026.
02
THE FINDING
AND ITS MEANING
A spectacular percentage can begin with a small workforce.
St. Joseph County, Indiana grew from 121.7 to 1,233 quarterly-average hosting jobs, an increase of 913.4%. It leads the eligible percentage-growth ranking, while placing 16 on concentration.
We'd keep that starting count in the headline.
Our growth ranks require at least 100 jobs in the base quarter. That's a safeguard against tiny bases, not a reason to stop looking at them. St. Joseph's gain is substantial, but the percentage alone can't tell a reader the scale of the workforce.
We also found a national gap: registered hosting establishments grew 122.68%, from 25,139 to 55,979, while jobs grew 46.46%. This is consistent with smaller operating units, but the record alone cannot prove that.
It could also include contractors or affiliates registering separately, reporting changes after reorganisations, or more sites with similar total staff.
Source records and definitions ↗Two measures of national expansion
% change, Q1 2019 to Q1 2026
Hosting establishments
+122.68%
Source: 25,139 to 55,979 registered establishments
Hosting jobs
+46.46%
Source: 333,974 to 489,122 quarterly-average jobs
Both changes use their own 2019 base. An establishment isn't necessarily a physical data centre or a separate company.
Our interpretation and the next reporting questionsWhat the evidence suggests, alternative explanations, and checks not yet performed.
What the boom would need to prove locally.
Our reading of the evidence, not an additional measured result.
St. Charles has 4,958 hosting jobs in the record. We'd compare that with a developer's promise only after checking what the promise counts: construction, permanent site staff or the wider business.
Those aren't interchangeable.
NAICS 518210 leaves construction out. Staff may be registered at an office away from the facility. A change of address can move the count without adding work. We'd need a date, a job definition and payroll-location evidence before linking a county gain to one site.
The consequence runs both ways. A town may subsidise a project on a jobs claim the record doesn't support, or dismiss new hiring that hasn't reached the federal count yet. Audit the agreed promise, not a convenient proxy.
What to investigate next
Open questions for further reporting. These aren't findings or interviews we claim to have completed.
- Get the developer's jobs table: construction versus permanent operating roles, reporting period, whether it uses NAICS 518210, and where each worker is registered.
- Match the largest local changes to employer registrations and filings, then ask whether hiring, relocation, reclassification or reporting explains the movement.
- Ask the county for its project subsidy conditions and reporting schedule, then audit permanent jobs against those terms when the site opens.
Behind the analysis
Inspect the source records 5 records / definitions / provenance
We link every comparison to the records used. Open the provenance download to check the selected values and the source-file checksums. Interpretation stays separate from those measured results.
- Source: E1
findings.jsonSource: id: GEO-01
- Source: E2
findings.jsonSource: id: GEO-02
- Source: E3
tables/geo_county.csvSource: area_fips: 29183 / CSV line 1586
- Source: E4
tables/geo_county.csvSource: area_fips: 51059 / CSV line 2860
- Source: E5
tables/geo_county.csvSource: area_fips: 18141 / CSV line 779
The leading places.
The defined measure.
We compare hosting jobs per 10,000 private jobs. Why use a rate? A large county doesn't lead simply because it has more workers. The national total has grown; this league shows where the industry's jobs are concentrated.
The chart shows the leading reportable locations. Lines start at zero. Counts come from the defined administrative record.
Source: BLS Quarterly Census of Employment and Wages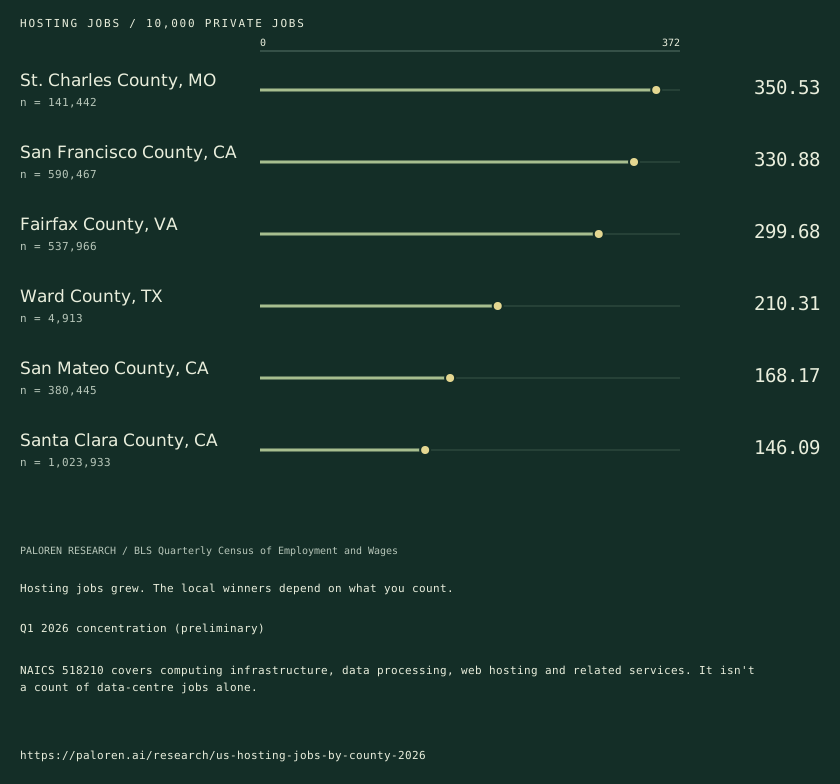
Reporter notes: explanations, unknowns and citationDownload the full briefing or inspect the sources and methods.
The finding.
The meaning.
The next question.
Where has hosting employment grown, and what would that mean for a local data-centre jobs promise?
Download reporter brief ↓Editorial edition / 26 October 2026489,122 US hosting jobs in Q1 2026. Quarterly average employment. 333,974 in Q1 2019; growth of 46.46%. Source period: Q1 2019 to Q1 2026.
NAICS 518210 covers computing infrastructure, data processing, web hosting and related services. It isn't a count of data-centre jobs alone. Employment and total private employment must be disclosed in both quarters, with at least 3 hosting establishments in Q1 2026. Growth ranks require at least 100 hosting jobs in Q1 2019.
Start with the promise made to residents. Does it mean construction work, permanent operating roles, or jobs across the whole hosting business? NAICS 518210 is only a fair audit if that distinction matches what was promised.
Other explanations and what we cannot answer
- Hiring could explain part of the rise. Registered-location changes, reclassification and reorganisations still need checking.
- More reporting units can make establishment counts grow even when physical facilities do not grow in proportion.
The industry code leaves construction out. Staff can be reported at offices away from a facility. Registration can change without work changing. So a claim that 'this data centre created these jobs' needs a definition, a date, and evidence that the workers are local.
Once a site opens, residents should be able to check permanent jobs against that specific promise.
Where the reporting goes next
- Ask the developer for its jobs table. Cover construction against permanent operating roles, the reporting period, whether it uses NAICS 518210, and where each worker is registered.
- Match the largest local changes to employer registrations and filings. Then ask whether hiring, relocation, reclassification or reporting explains the movement.
- Ask the county for project subsidy conditions and its reporting schedule. When a site opens, audit permanent jobs against those terms.
We haven't done these checks yet. They're a route for further reporting, not extra findings.
Sources, methods and citation
No one was interviewed for this brief, and no cause was tested.
We updated this brief on 26 October 2026. We haven't refreshed the data. Use the period beside the finding.
Copyable citation
Paloren Research. US hosting jobs grew 46%. Where did they land?. Editorial edition 26 October 2026. https://paloren.ai/research/us-hosting-jobs-by-county-2026
Use our analysis with credit to Paloren Research and a link. Don't drop the caveats. We can't grant rights to a source publisher's material.
Request comment or a correction ↗Method and limitationsDefinitions, exclusions, source records and the checks behind this edition.
What this can
and cannot say.
Employment and total private employment must be disclosed in both quarters, with at least 3 hosting establishments in Q1 2026. Growth ranks require at least 100 hosting jobs in Q1 2019.
Open the primary source ↗- 01
We locate jobs at the establishment registered for unemployment insurance. That isn't always a data centre: a firm can report staff at an office in a different county from its buildings. Construction work falls outside NAICS 518210.
- 02
Suppressed doesn't mean zero. We leave BLS-suppressed places out of the league.
- 03
Q1 2026 is preliminary. BLS can revise it. We're counting covered employers, not estimating from a sample, so we don't attach a sampling interval to these counts.
Leave with the record.
Keep the definition, period and qualification with any figure you reuse. The download includes the local facts supplied by the study, source-row references and reporting rules.
Request comment or a source check ↗How to read
our research.
Original analysis, with the evidence and its limits kept together.
Publisher and methods
We're part of Paloren, an AI consultancy and commercial publisher. We don't claim to be an independent research institution.
We show what we counted, then explain our reading of it. They're different. An AI name isn't proof of an AI business; a filing's warning isn't an incident report.
Corrections and version history 26 October 2026
We changed the articles on 26 October 2026, not the source data. Edition newsroom-20261026.
- Copy edit / 28 October 2026 / Research copy notes
We made copy edits for clarity and consistency. Methods, findings and figures have not changed.
- Reading and presentation update / All ten studies
The opening links to the downloadable briefing. Local tables come first. You can expand secondary detail or print the study, keeping the source notes and caveats beside the results so they don't get lost when you share a finding. Source values are unchanged. We also corrected punctuation and displayed council-record grammar.
- Editorial update / All ten studies
Each of the ten studies now has a brief. It sets out what we found, our take, and what we'd need to check next. The datasets haven't been refreshed.
We keep each source period beside its finding. We haven't set a schedule for new data releases.
Reuse and corrections
Use our original charts and analysis with credit to Paloren Research and a link. Keep the source period and caveats. We can't grant rights to material owned by a source publisher.
Found a mistake? Send us the page and the record we should check at aaron@palorenresearch.com.
For a quote from Aaron, please ask for a current comment. Our labelled analysis isn't a spoken quotation.
Work / United StatesThe same jobs. A different AI exposure ranking.↗Company registers / United KingdomLondon has an AI-name cluster. It is not yet an industry map.↗Business registers / AustraliaNSW leads one AI-register measure. The ACT leads another.↗
All local investigations ↗Research
Local investigations
Media
Paloren

A finding is a starting point. Bring it to Paloren and we will test what it means for your business.
Talk to Paloren