

THE PUBLIC RECORD / PALORENFIELD NOTES / 12
New South Wales has the highest reportable AI-named registrations per resident in 2025. The ACT has the highest share of AI-named records among new active ABNs in 2024 to 2026. Neither league proves where AI firms operate.
0.99
AI-named registrations per 1,000 new active ABNs
2,923 AI-named registrations out of 2,954,292 active ABNs in the defined window.2024 to 2026 / snapshot 21 October 2026READ THIS WITH THE NUMBER
The name rule has 80.0% precision. An active ABN isn't proof of a trading business or an AI product.
Analysis by
Paloren Research
What we set out to find.
We checked 2,954,292 active ABNs with status-start dates in 2024 to 2026 for AI-related business names. Where do the matches cluster? We compared rates per resident with shares of registrations.
What we found
We found 2,923 matches. That's 0.99 per 1,000 new active ABNs in the defined window. NSW leads the state measure of 2025 registrations per resident; use the share of registrations with AI names instead, and the ACT comes first.
How we did it, and what it cannot tell us ↗Find your place.
Take the evidence.
We've made 6 reportable states and territories searchable. Start with a name. We keep the count and caveat beside each finding so you can check what you're quoting. A missing place isn't a zero.
States and territories
| Rank | Place | 2025 registrations / 100,000 residents | Resident population (2025) |
|---|---|---|---|
| 1 | New South Wales | 5.66 | 8,592,524 |
| 2 | Australian Capital Territory | 5.16 | 484,630 |
| 3 | Victoria | 4.38 | 7,073,859 |
| 4 | Queensland | 3.49 | 5,669,764 |
| 5 | Western Australia | 2.17 | 3,044,382 |
| 6 | South Australia | 1.94 | 1,902,665 |
Postcodes
| Rank | Place | 2024 to 2026 / 1,000 active ABNs | New active ABNs (n) |
|---|---|---|---|
| 1 | postcode 3004 (VIC) | 6.58 | 4,866 |
| 2 | postcode 2060 (NSW) | 5.58 | 4,659 |
| 3 | postcode 2000 (NSW) | 5.37 | 31,669 |
| 4 | postcode 2010 (NSW) | 4.26 | 10,088 |
| 5 | postcode 2153 (NSW) | 3.31 | 8,753 |
| 6 | postcode 2150 (NSW) | 3.11 | 8,672 |
| 7 | postcode 3000 (VIC) | 1.8 | 27,855 |
| 8 | postcode 4000 (QLD) | 1.54 | 15,608 |
No reportable match. Try a shorter name or switch geography.
At least 20 AI-named registrations and 100 total new active ABNs in 2024 to 2026. State rates use 2025 AI-named registrations and ABS resident population for June 2025.
01
THE FINDING
AND ITS MEANING
A small jurisdiction can sit near the top without a large count.
New South Wales has 486 AI-named registrations with 2025 status-start dates and 8,592,524 residents: 5.66 per 100,000. For the ACT, we counted 25 matches among 484,630 residents: 5.16 per 100,000.
The counts are far apart. The rates are close.
Victoria makes the contrast plain. Its 310 AI-named registrations among 7,073,859 residents give a rate of 4.38. The ACT has fewer matches but a higher rate. For NSW, the rate shows scale across a large base; for the ACT, it shows frequency in a small jurisdiction. Neither number identifies a pool of operating employers.
Source records and definitions ↗The count and the population-adjusted view
New South Wales
AI-named status starts in calendar 2025486
2025 registrations / 100,000 residents5.66
Source: Population denominator: 8,592,524 residents, June 2025.
Australian Capital Territory
AI-named status starts in calendar 202525
2025 registrations / 100,000 residents5.16
Source: Population denominator: 484,630 residents, June 2025.
Victoria
AI-named status starts in calendar 2025310
2025 registrations / 100,000 residents4.38
Source: Population denominator: 7,073,859 residents, June 2025.
Separate scales, same 2025 registration period. Census counts of the defined register; no sampling intervals.
02
THE FINDING
AND ITS MEANING
Use registrations as the base, and the ACT comes first.
In the 2024 to 2026 window, the ACT has 70 AI-named records among 42,688 new active ABNs: 1.64 per 1,000. NSW has 1,229 among 953,383: 1.29 per 1,000.
Now we are asking a different question.
How often does an AI name appear among new active ABNs? We aren't comparing with residents in this view, and the period changes too. So we can't attribute the switch in leader to the denominator alone.
There's another reason for care. A sole trader can sit among the ACT's 42,688 new active ABNs while their personal name stays out of its 70 matched names. A jurisdiction with more companies and non-individual entities could therefore look more AI-active without different founder behaviour. We haven't measured that composition effect.
Source records and definitions ↗AI names as a share of active-ABN registrations
AI-named / 1,000 registrations, 2024 to 2026
Australian Capital Territory
1.64
Source: 70 AI-named / 42,688 new active ABNs
New South Wales
1.29
Source: 1,229 AI-named / 953,383 new active ABNs
Victoria
0.99
Source: 788 AI-named / 793,819 new active ABNs
Status-start dates through 21 October 2026. Active records only; a status start can be a reinstatement. No sampling intervals.
Our interpretation and the next reporting questionsWhat the evidence suggests, alternative explanations, and checks not yet performed.
A register can reveal ambition before it proves activity.
Our reading of the evidence, not an additional measured result.
We'd follow the ACT's names into the businesses themselves. Are they selling an AI product or service? Have they hired, raised capital, won customers, or just registered an intention? An active ABN can't answer those questions.
The ACT's 2024-to-2026 lead is a reporting lead, not proof. NSW's separate 2025 result doesn't settle it.
The rule achieved 80.0% precision in its validation sample. We haven't measured recall. False matches push our count up; missed names pull it down. Neither tells us the net error for NSW or the ACT.
We'd need trading records, entity types and a count of reinstatements to judge either policy.
The consequence is a misread local economy. NSW has 1,229 matched names, not 1,229 verified AI employers. Genuine AI firms may have names that miss our rule entirely.
What to investigate next
Open questions for further reporting. These aren't findings or interviews we claim to have completed.
- Sample from the 1,229 NSW and 70 ACT registrations within the 2,923 national matches, then check whether each is trading, sells an AI product and employs anyone.
- Rebuild each ABN history. Was the status start a first registration or a return? Compare companies, trusts, partnerships and sole traders.
- Check products and staff in NSW and the ACT before calling either result a cluster of operating AI businesses.
Behind the analysis
Inspect the source records 3 records / definitions / provenance
We link every comparison to the records used. Open the provenance download to check the selected values and the source-file checksums. Interpretation stays separate from those measured results.
- Source: E1
tables/geo_state.csvSource: state: NSW / CSV line 2
- Source: E2
tables/geo_state.csvSource: state: ACT / CSV line 3
- Source: E3
tables/geo_state.csvSource: state: VIC / CSV line 4
The leading places.
The defined measure.
The state league uses calendar 2025 registrations per 100,000 residents. The national headline and postcode table instead use the share of active ABNs with status-start dates in 2024 to 2026. Those measures answer different questions.
The chart shows the leading reportable locations. Lines start at zero. Counts come from the defined administrative record.
Source: Australian Business Register and ABS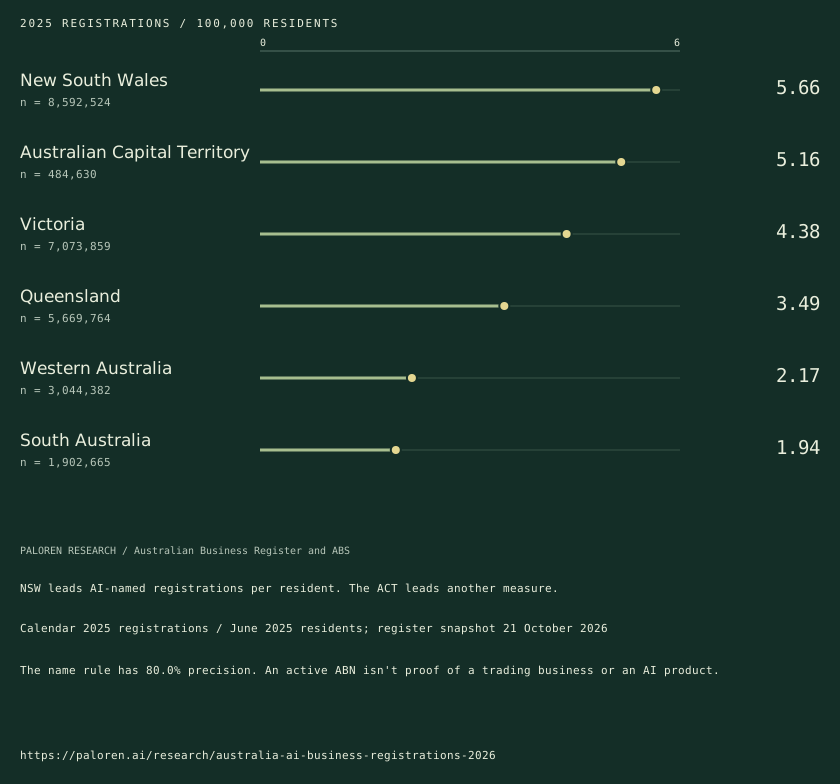
Reporter notes: explanations, unknowns and citationDownload the full briefing or inspect the sources and methods.
The finding.
The meaning.
The next question.
Which Australian jurisdictions have more AI-named registrations, and does the answer change with the denominator?
Download reporter brief ↓Editorial edition / 26 October 20260.99 AI-named registrations per 1,000 new active ABNs. 2,923 AI-named registrations out of 2,954,292 active ABNs in the defined window. Source period: 2024 to 2026 / snapshot 21 October 2026.
The name rule has 80.0% precision. An active ABN is not proof of a trading business or an AI product. A state row needs at least 20 matched entries and 100 total new active ABNs in 2024 to 2026. State rates use 2025 matches and ABS resident population for June 2025.
Follow the ACT's names into the businesses themselves. Are they selling an AI product or service? Have they hired, raised capital or won customers, or did they simply register an intention? An active ABN answers none of those questions.
Other explanations and what we cannot answer
- Entity mix can move the rate because individual names are left out of the numerator while sole traders stay in the denominator.
- A status start may be a reinstatement, not the creation of a new trading business.
The name rule has 80.0% measured precision in its validation sample. Recall is not measured. False positives inflate the matched count; missed names work the other way. Those two facts are not enough to establish the net error for a state.
Before judging NSW or ACT innovation policy, we'd need trading evidence plus the entity mix and the share of status starts that are reinstatements.
Where the reporting goes next
- Sample from the 1,229 NSW and 70 ACT registrations within the 2,923 national matches, then check whether each is trading, sells an AI product and employs anyone.
- Rebuild each ABN history. Was the status start a first registration or a return? Compare companies, trusts, partnerships and sole traders.
- Check products and staff in NSW and the ACT before calling either result a cluster of operating AI businesses.
We haven't done these checks yet. They're a route for further reporting, not extra findings.
Sources, methods and citation
No one was interviewed for this brief, and no cause was tested.
We updated this brief on 26 October 2026. We haven't refreshed the data. Use the period beside the finding.
Copyable citation
Paloren Research. Where are AI-named businesses registering in Australia?. Editorial edition 26 October 2026. https://paloren.ai/research/australia-ai-business-registrations-2026
Use our analysis with credit to Paloren Research and a link. Don't drop the caveats. We can't grant rights to a source publisher's material.
Request comment or a correction ↗Method and limitationsDefinitions, exclusions, source records and the checks behind this edition.
What this can
and cannot say.
At least 20 AI-named registrations and 100 total new active ABNs in 2024 to 2026. State rates use 2025 AI-named registrations and ABS resident population for June 2025.
Open the primary source ↗- 01
We use the date the ABN's current status began. That can be a fresh start after reinstatement, not its first registration. Cancelled ABNs aren't in this active-only snapshot, so we can't measure churn from it.
- 02
We count sole traders in the base, but don't match their personal names.
- 03
No sampling ranges are shown. These are census counts of the defined register. Only eight postcodes clear our rules; they're a secondary view, not a way to rank every Australian neighbourhood.
Leave with the record.
Keep the definition, period and qualification with any figure you reuse. The download includes the local facts supplied by the study, source-row references and reporting rules.
Request comment or a source check ↗How to read
our research.
Original analysis, with the evidence and its limits kept together.
Publisher and methods
We're part of Paloren, an AI consultancy and commercial publisher. We don't claim to be an independent research institution.
We show what we counted, then explain our reading of it. They're different. An AI name isn't proof of an AI business; a filing's warning isn't an incident report.
Corrections and version history 26 October 2026
We changed the articles on 26 October 2026, not the source data. Edition newsroom-20261026.
- Copy edit / 28 October 2026 / Research copy notes
We made copy edits for clarity and consistency. Methods, findings and figures have not changed.
- Reading and presentation update / All ten studies
The opening links to the downloadable briefing. Local tables come first. You can expand secondary detail or print the study, keeping the source notes and caveats beside the results so they don't get lost when you share a finding. Source values are unchanged. We also corrected punctuation and displayed council-record grammar.
- Editorial update / All ten studies
Each of the ten studies now has a brief. It sets out what we found, our take, and what we'd need to check next. The datasets haven't been refreshed.
We keep each source period beside its finding. We haven't set a schedule for new data releases.
Reuse and corrections
Use our original charts and analysis with credit to Paloren Research and a link. Keep the source period and caveats. We can't grant rights to material owned by a source publisher.
Found a mistake? Send us the page and the record we should check at aaron@palorenresearch.com.
For a quote from Aaron, please ask for a current comment. Our labelled analysis isn't a spoken quotation.
Infrastructure / United StatesThe hosting boom is bigger than the data-centre count.↗Work / United StatesThe same jobs. A different AI exposure ranking.↗Company registers / United KingdomLondon has an AI-name cluster. It is not yet an industry map.↗
All local investigations ↗Research
Local investigations
Media
Paloren

A finding is a starting point. Bring it to Paloren and we will test what it means for your business.
Talk to Paloren