

THE PUBLIC RECORD / PALORENFIELD NOTES / 11
Islington leads the rate of AI-named registrations; Camden has more of them. The register tells us where to look, not where people work, invest, sell or build products.
4.5
AI-named companies per 1,000 new registrations
7,924 AI-named companies out of 1,761,691 registrations in the defined window.2024 to 2026 / snapshot 1 October 2026READ THIS WITH THE NUMBER
A name isn't proof of AI work. The name rule had 85.5% to 90.0% precision across two blind coders.
Analysis by
Paloren Research
What we set out to find.
We searched 1,761,691 UK-located company registrations from 2024 to 2026 in the October snapshot for AI names. Where do they cluster? We divided each local count by all new registrations there, so London wouldn't lead merely because it has more companies.
What we found
We found 7,924 AI-named companies, or 4.5 per 1,000 registrations. Islington leads the reportable local rate. Camden has more matches. London also leads the regional rate after we account for the size of its registration base.
How we did it, and what it cannot tell us ↗Find your place.
Take the evidence.
We've made 79 reportable local authorities searchable. Start with a name. We keep the count and caveat beside each finding so you can check what you're quoting. A missing place isn't a zero.
Local authorities
| Rank | Place | AI-named / 1,000 registrations | New registrations (n) | Wilson 95% interval |
|---|---|---|---|---|
| 1 | Islington | 11.12 | 54,945 | 10.28 to 12.03 |
| 2 | Camden | 10.59 | 81,054 | 9.9 to 11.31 |
| 3 | St Albans | 8.87 | 3,609 | 6.29 to 12.49 |
| 4 | Cambridge | 8.8 | 4,433 | 6.44 to 12 |
| 5 | Westminster | 8.71 | 48,470 | 7.92 to 9.57 |
| 6 | Hackney | 8.52 | 58,131 | 7.8 to 9.3 |
| 7 | South Cambridgeshire | 8.48 | 3,184 | 5.83 to 12.31 |
| 8 | Wokingham | 8.37 | 4,302 | 6.05 to 11.56 |
| 9 | Kensington and Chelsea | 8.36 | 6,100 | 6.36 to 10.98 |
| 10 | Bath and North East Somerset | 7.63 | 3,015 | 5.09 to 11.42 |
| 11 | Kingston upon Thames | 7.6 | 4,476 | 5.44 to 10.6 |
| 12 | Oxford | 7.44 | 2,688 | 4.82 to 11.47 |
| 13 | Oldham | 7.33 | 6,819 | 5.57 to 9.65 |
| 14 | City of London | 7.01 | 11,838 | 5.66 to 8.68 |
| 15 | Lambeth | 6.98 | 8,745 | 5.43 to 8.95 |
| 16 | Brighton and Hove | 6.75 | 6,819 | 5.06 to 8.99 |
| 17 | Elmbridge | 6.7 | 3,730 | 4.54 to 9.88 |
| 18 | Trafford | 6.3 | 8,089 | 4.8 to 8.28 |
| 19 | West Suffolk | 6.15 | 16,100 | 5.05 to 7.48 |
| 20 | Tower Hamlets | 6.04 | 22,026 | 5.1 to 7.15 |
| 21 | Wandsworth | 6.01 | 8,647 | 4.59 to 7.88 |
| 22 | Richmond upon Thames | 5.62 | 4,984 | 3.89 to 8.11 |
| 23 | Warwick | 5.52 | 3,802 | 3.62 to 8.43 |
| 24 | Milton Keynes | 5.39 | 9,273 | 4.09 to 7.1 |
| 25 | Southwark | 5.33 | 9,389 | 4.04 to 7.01 |
| 26 | Bedford | 5.23 | 4,210 | 3.45 to 7.9 |
| 27 | Buckinghamshire | 5.22 | 13,974 | 4.16 to 6.56 |
| 28 | Cardiff | 5.05 | 19,607 | 4.15 to 6.14 |
| 29 | Dartford | 5 | 4,000 | 3.24 to 7.71 |
| 30 | City of Edinburgh | 4.96 | 14,302 | 3.94 to 6.26 |
| 31 | Waltham Forest | 4.95 | 13,119 | 3.89 to 6.31 |
| 32 | Lewisham | 4.92 | 6,711 | 3.5 to 6.9 |
| 33 | Hounslow | 4.92 | 10,767 | 3.77 to 6.43 |
| 34 | Newham | 4.87 | 21,787 | 4.02 to 5.88 |
| 35 | Brent | 4.82 | 12,861 | 3.76 to 6.17 |
| 36 | Herefordshire, County of | 4.78 | 9,838 | 3.59 to 6.35 |
| 37 | Solihull | 4.67 | 4,926 | 3.11 to 7 |
| 38 | Croydon | 4.6 | 12,620 | 3.56 to 5.94 |
| 39 | Hillingdon | 4.57 | 16,206 | 3.64 to 5.73 |
| 40 | Newcastle upon Tyne | 4.51 | 6,430 | 3.14 to 6.47 |
| 41 | Bury | 4.5 | 5,776 | 3.07 to 6.59 |
| 42 | Hertsmere | 4.43 | 4,518 | 2.87 to 6.83 |
| 43 | Ealing | 4.4 | 13,876 | 3.42 to 5.64 |
| 44 | Slough | 4.37 | 6,641 | 3.04 to 6.26 |
| 45 | Bristol, City of | 4.23 | 9,683 | 3.12 to 5.74 |
| 46 | Cheshire East | 4.22 | 9,481 | 3.1 to 5.74 |
| 47 | Bromley | 4.18 | 9,573 | 3.07 to 5.68 |
| 48 | Merton | 4.17 | 8,152 | 2.99 to 5.82 |
| 49 | Belfast | 4.17 | 7,190 | 2.92 to 5.95 |
| 50 | Hammersmith and Fulham | 4.13 | 10,165 | 3.06 to 5.58 |
| 51 | Bournemouth, Christchurch and Poole | 4.12 | 8,502 | 2.96 to 5.72 |
| 52 | Barnet | 4.1 | 19,766 | 3.3 to 5.09 |
| 53 | Harrow | 4.09 | 15,166 | 3.19 to 5.24 |
| 54 | Glasgow City | 3.95 | 18,996 | 3.15 to 4.95 |
| 55 | Redbridge | 3.87 | 18,358 | 3.07 to 4.88 |
| 56 | Haringey | 3.68 | 10,333 | 2.68 to 5.04 |
| 57 | Havering | 3.65 | 8,485 | 2.58 to 5.18 |
| 58 | Greenwich | 3.59 | 9,188 | 2.56 to 5.04 |
| 59 | Stockport | 3.58 | 8,108 | 2.49 to 5.13 |
| 60 | Manchester | 3.57 | 32,480 | 2.98 to 4.28 |
| 61 | Warrington | 3.57 | 5,597 | 2.31 to 5.51 |
| 62 | Birmingham | 3.42 | 38,543 | 2.89 to 4.06 |
| 63 | Bexley | 3.38 | 6,512 | 2.23 to 5.11 |
| 64 | Leeds | 3.37 | 19,568 | 2.65 to 4.29 |
| 65 | Central Bedfordshire | 3.29 | 6,072 | 2.13 to 5.08 |
| 66 | Salford | 3.28 | 8,242 | 2.25 to 4.76 |
| 67 | Bolton | 3.21 | 9,979 | 2.27 to 4.52 |
| 68 | Barking and Dagenham | 3.14 | 10,493 | 2.24 to 4.41 |
| 69 | Enfield | 2.95 | 13,198 | 2.16 to 4.04 |
| 70 | West Northamptonshire | 2.93 | 9,887 | 2.04 to 4.21 |
| 71 | Coventry | 2.89 | 11,403 | 2.06 to 4.06 |
| 72 | Sheffield | 2.89 | 11,080 | 2.05 to 4.07 |
| 73 | Somerset | 2.8 | 7,863 | 1.85 to 4.23 |
| 74 | North Yorkshire | 2.63 | 10,653 | 1.82 to 3.8 |
| 75 | Liverpool | 2.48 | 14,087 | 1.79 to 3.45 |
| 76 | Nottingham | 2.47 | 8,104 | 1.6 to 3.81 |
| 77 | Bradford | 2.23 | 13,887 | 1.57 to 3.17 |
| 78 | Kirklees | 2.18 | 10,095 | 1.44 to 3.3 |
| 79 | Leicester | 1.94 | 11,360 | 1.28 to 2.93 |
Regions
| Rank | Place | AI-named / 1,000 registrations | New registrations (n) | Wilson 95% interval |
|---|---|---|---|---|
| 1 | London | 6.89 | 571,172 | 6.68 to 7.11 |
| 2 | South East | 4.34 | 195,968 | 4.06 to 4.64 |
| 3 | East of England | 3.91 | 154,907 | 3.61 to 4.24 |
| 4 | North West | 3.39 | 186,597 | 3.14 to 3.67 |
| 5 | Wales | 3.23 | 57,289 | 2.8 to 3.73 |
| 6 | South West | 3.21 | 91,975 | 2.86 to 3.59 |
| 7 | Scotland | 3.1 | 91,594 | 2.76 to 3.48 |
| 8 | Northern Ireland | 3.1 | 24,172 | 2.48 to 3.89 |
| 9 | West Midlands | 3.08 | 144,731 | 2.81 to 3.38 |
| 10 | Yorkshire and The Humber | 2.66 | 107,834 | 2.37 to 2.99 |
| 11 | North East | 2.5 | 43,687 | 2.07 to 3.01 |
| 12 | East Midlands | 2.39 | 91,765 | 2.09 to 2.72 |
Nations
| Rank | Place | AI-named / 1,000 registrations | New registrations (n) | Wilson 95% interval |
|---|---|---|---|---|
| 1 | England | 4.65 | 1,588,636 | 4.54 to 4.75 |
| 2 | Wales | 3.23 | 57,289 | 2.8 to 3.73 |
| 3 | Scotland | 3.1 | 91,594 | 2.76 to 3.48 |
| 4 | Northern Ireland | 3.1 | 24,172 | 2.48 to 3.89 |
No reportable match. Try a shorter name or switch geography.
At least 20 AI-named companies and 100 total new registrations in 2024 to 2026. Rates use registrations present in the same snapshot and period.
01
THE FINDING
AND ITS MEANING
Islington leads the rate. Camden has the larger count.
Islington has 611 AI-named companies among 54,945 registrations. That is 11.12 per 1,000, with a Wilson 95% interval of 10.28 to 12.03. Camden has more matches: 858 among 81,054 registrations, or 10.59 per 1,000. Its interval is 9.9 to 11.31.
We'd report the count and the rate together.
Camden gives us the larger list of names to investigate. In Islington, an AI name appears more often among new registrations. We'd keep both views: volume for the scale of a reporting exercise, rate for the frequency of AI naming. Neither is a clear statistical winner because the intervals overlap.
Source records and definitions ↗A larger count can come with a lower rate
Islington
AI-named registrations, 2024 to 2026611
AI-named / 1,000 registrations11.12
Source: Base: 54,945 registrations. Rate: Wilson 95% interval 10.28 to 12.03.
Camden
AI-named registrations, 2024 to 2026858
AI-named / 1,000 registrations10.59
Source: Base: 81,054 registrations. Rate: Wilson 95% interval 9.9 to 11.31.
The two columns use separate scales. Registered-office location, snapshot 1 October 2026. A name isn't evidence of an operating AI business.
02
THE FINDING
AND ITS MEANING
London's lead survives the size adjustment. Its meaning still needs checking.
London records 3,935 AI-named companies in a base of 571,172. Its rate is 6.89 per 1,000 (Wilson 95% interval 6.68 to 7.11). The South East records 850 in 195,968, or 4.34 per 1,000 (interval 4.06 to 4.64).
Size alone doesn't explain London's rate.
We divided by the registration base, and AI names still appear more often in London. Three explanations remain: London may genuinely attract more AI founders; service providers may concentrate AI-labelled registrations there; and the name rule may fit the language used in some founder communities better than others. Employees, products and investment are needed to separate them.
We'd also resist a simple boom narrative from older cohorts. Dissolved companies can disappear from the snapshot, leaving fewer surviving records from earlier years. Comparing those counts doesn't give a clean growth measure.
Source records and definitions ↗Our interpretation and the next reporting questionsWhat the evidence suggests, alternative explanations, and checks not yet performed.
Treat the register as a reporting list.
Our reading of the evidence, not an additional measured result.
Islington's result gives us a reporting list. We'd still need to find out where staff work, whether a company is trading, what it sells, and whether its AI description fits its product.
An AI name gets us to the door, but no further.
The rule's measured precision is 85.5% to 90.0% in its validation sample. Some matches are false positives, but that national check does not establish the error rate in each borough.
We have not measured names the rule misses. This is neither a map of London's whole AI industry nor evidence about investment or jobs.
In Islington or Camden, over-reading can turn addresses into a policy story. For a listed company, it can impose an unfair label. Verification protects both.
What to investigate next
Open questions for further reporting. These aren't findings or interviews we claim to have completed.
- Take a random sample from Islington and Camden, then check each company's website, filings and registered agent to separate trading firms from dormant or service-address records.
- Ask matched firms what they sell, where staff work, whether AI is central, and how many employees they have; publish the refusals and nonresponses.
- Ask local business groups which names they recognise as employers. Missing names would be evidence that the register misses actual operating businesses.
Behind the analysis
Inspect the source records 4 records / definitions / provenance
We link every comparison to the records used. Open the provenance download to check the selected values and the source-file checksums. Interpretation stays separate from those measured results.
- Source: E1
tables/geo_la.csvSource: code: E09000019 / CSV line 2
- Source: E2
tables/geo_la.csvSource: code: E09000007 / CSV line 3
- Source: E3
tables/geo_region.csvSource: code: London / CSV line 2
- Source: E4
tables/geo_region.csvSource: code: South East / CSV line 3
The leading places.
The defined measure.
Islington and Camden lead the reportable local-authority table. These are registered addresses: an accountant or formation agent can concentrate registrations far from the companies doing the work.
Dots show the reported value. Lines show the wilson 95% interval. A rank isn't a test of differences.
Source: Companies House and ONS postcode lookup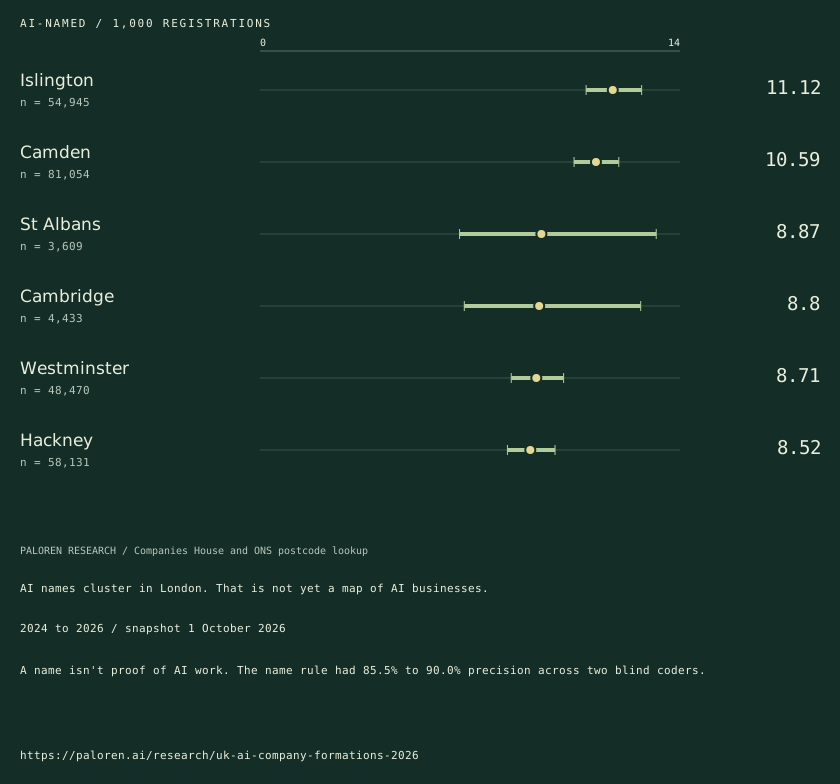
Reporter notes: explanations, unknowns and citationDownload the full briefing or inspect the sources and methods.
The finding.
The meaning.
The next question.
Where do AI-related company names cluster, and how far can a registered address take us toward an industry map?
Download reporter brief ↓Editorial edition / 26 October 20264.5 AI-named companies per 1,000 new registrations. 7,924 AI-named companies out of 1,761,691 registrations in the defined window. Source period: 2024 to 2026 / snapshot 1 October 2026.
A name isn't proof of AI work. The name rule had 85.5% to 90.0% precision across two blind coders. At least 20 AI-named companies and 100 total new registrations in 2024 to 2026. Rates use registrations present in the same snapshot and period.
Treat Islington's result as a reporting list, not a conclusion. The missing evidence is operational: where staff work, whether the company trades, what it sells, and whether its AI description fits the product.
Other explanations and what we cannot answer
- A real cluster of founders and a concentration of registration-service addresses can both lift a local rate.
- The name rule may fit some businesses better than others, and dissolved firms are absent from this surviving-register snapshot.
The rule's measured precision is 85.5% to 90.0% in its validation sample. Some matches are false positives, but that national check does not establish the error rate in each borough.
We have not measured names the rule misses. This is neither a map of London's whole AI industry nor evidence about investment or jobs.
Where the reporting goes next
- Take a random sample from Islington and Camden. Check each company's website, filings and registered agent to separate trading firms from dormant or service-address records.
- Ask matched firms what they sell, where staff work, whether AI is central and how many employees they have. Publish refusals and nonresponses.
- Ask local business groups which names they recognise as employers. Missing names would show that the register misses actual operating businesses.
We haven't done these checks yet. They're a route for further reporting, not extra findings.
Sources, methods and citation
No one was interviewed for this brief, and no cause was tested.
We updated this brief on 26 October 2026. We haven't refreshed the data. Use the period beside the finding.
Copyable citation
Paloren Research. Where are AI-named companies registering in Britain?. Editorial edition 26 October 2026. https://paloren.ai/research/uk-ai-company-formations-2026
Use our analysis with credit to Paloren Research and a link. Don't drop the caveats. We can't grant rights to a source publisher's material.
Request comment or a correction ↗Method and limitationsDefinitions, exclusions, source records and the checks behind this edition.
What this can
and cannot say.
At least 20 AI-named companies and 100 total new registrations in 2024 to 2026. Rates use registrations present in the same snapshot and period.
Open the primary source ↗- 01
We count what's still in the Companies House snapshot on 1 October 2026. It holds live and recently dissolved companies; older dissolved firms can be gone. We can't call this a count of every company ever formed.
- 02
An address isn't a workplace. We don't infer where a company operates.
- 03
We show no sampling range for the national census count. Local shares carry the supplied Wilson 95% intervals. Those ranges don't measure errors in our name rule, whose precision was 85.5% to 90.0% in blind review.
Leave with the record.
Keep the definition, period and qualification with any figure you reuse. The download includes the local facts supplied by the study, source-row references and reporting rules.
Request comment or a source check ↗How to read
our research.
Original analysis, with the evidence and its limits kept together.
Publisher and methods
We're part of Paloren, an AI consultancy and commercial publisher. We don't claim to be an independent research institution.
We show what we counted, then explain our reading of it. They're different. An AI name isn't proof of an AI business; a filing's warning isn't an incident report.
Corrections and version history 26 October 2026
We changed the articles on 26 October 2026, not the source data. Edition newsroom-20261026.
- Names and number formatting / 28 October 2026 / Local copy corrections
UK company totals now use thousands separators in local facts. H-1B state names are written out, and the credentials study uses the correct singular or plural for reporting institutions. The figures haven't changed.
- Copy edit / 28 October 2026 / Research copy notes
We made copy edits for clarity and consistency. Methods, findings and figures have not changed.
- Reading and presentation update / All ten studies
The opening links to the downloadable briefing. Local tables come first. You can expand secondary detail or print the study, keeping the source notes and caveats beside the results so they don't get lost when you share a finding. Source values are unchanged. We also corrected punctuation and displayed council-record grammar.
- Editorial update / All ten studies
Each of the ten studies now has a brief. It sets out what we found, our take, and what we'd need to check next. The datasets haven't been refreshed.
We keep each source period beside its finding. We haven't set a schedule for new data releases.
Reuse and corrections
Use our original charts and analysis with credit to Paloren Research and a link. Keep the source period and caveats. We can't grant rights to material owned by a source publisher.
Found a mistake? Send us the page and the record we should check at aaron@palorenresearch.com.
For a quote from Aaron, please ask for a current comment. Our labelled analysis isn't a spoken quotation.
Infrastructure / United StatesThe hosting boom is bigger than the data-centre count.↗Work / United StatesThe same jobs. A different AI exposure ranking.↗Business registers / AustraliaNSW leads one AI-register measure. The ACT leads another.↗
All local investigations ↗Research
Local investigations
Media
Paloren

A finding is a starting point. Bring it to Paloren and we will test what it means for your business.
Talk to Paloren