

THE PUBLIC RECORD / PALORENFIELD NOTES / 10
23.2% of matched US jobs are in occupations with high task exposure. The rating is useful for showing where work could change, but the local rank moves with the score and says nothing on its own about layoffs.
23.2%
of matched US jobs in highly exposed occupations
Approximate 95% interval: 23.1% to 23.2%. Matched employment: n = 143,751,120.May 2025 employment / 2023 exposure scoresREAD THIS WITH THE NUMBER
Exposure means tasks an LLM could speed up. It isn't a job-loss forecast. We don't measure actual AI use or count people who will be replaced.
Analysis by
Paloren Research
What we set out to find.
We matched 143,751,120 US jobs to occupation-level AI exposure scores. Where could tasks change most? To check whether the answer rests on the score we chose, we ranked 393 reportable metros twice using the same jobs data.
What we found
We classified 23.2% of matched jobs as highly exposed, with an approximate 95% interval of 23.1% to 23.2%. Then the local order moved. Boulder rises under the second score; Olympia falls. No jobs have changed between those calculations.
How we did it, and what it cannot tell us ↗Find your place.
Take the evidence.
We've made 393 reportable metro areas searchable. Start with a name. We keep the count and caveat beside each finding so you can check what you're quoting. A missing place isn't a zero.
Metro areas
| Rank | Place | Highly exposed / matched jobs (%) | Matched jobs (n) | Approximate 95% interval |
|---|---|---|---|---|
| 1 | Lexington Park, MD | 32.3% | 61,610 | 31.6 to 33 |
| 2 | Olympia-Lacey-Tumwater, WA | 32% | 115,100 | 31.6 to 32.4 |
| 3 | Durham-Chapel Hill, NC | 31.9% | 282,010 | 31.5 to 32.4 |
| 4 | Trenton-Princeton, NJ | 31.8% | 205,330 | 31.5 to 32.2 |
| 5 | Boulder, CO | 31.7% | 170,070 | 31 to 32.5 |
| 6 | Tallahassee, FL | 31.3% | 165,850 | 30.9 to 31.7 |
| 7 | Washington-Arlington-Alexandria, DC-VA-MD-WV | 29.4% | 2,916,220 | 29.1 to 29.7 |
| 8 | San Jose-Sunnyvale-Santa Clara, CA | 28.8% | 1,016,950 | 28.5 to 29.2 |
| 9 | Raleigh-Cary, NC | 28.8% | 694,300 | 28.2 to 29.3 |
| 10 | Austin-Round Rock-San Marcos, TX | 28.6% | 1,203,840 | 28.2 to 29 |
| 11 | Denver-Aurora-Centennial, CO | 28.4% | 1,479,590 | 27.7 to 29 |
| 12 | Lansing-East Lansing, MI | 28.1% | 190,530 | 27.8 to 28.4 |
| 13 | Huntsville, AL | 28% | 235,090 | 27.4 to 28.6 |
| 14 | Seattle-Tacoma-Bellevue, WA | 27.9% | 1,923,730 | 27.2 to 28.6 |
| 15 | Helena, MT | 27.9% | 36,300 | 27.3 to 28.5 |
| 16 | San Francisco-Oakland-Fremont, CA | 27.6% | 2,110,070 | 27.3 to 28 |
| 17 | Salt Lake City-Murray, UT | 27.4% | 750,850 | 27 to 27.9 |
| 18 | Boston-Cambridge-Newton, MA-NH | 27.3% | 2,477,050 | 27 to 27.7 |
| 19 | Des Moines-West Des Moines, IA | 27% | 371,400 | 26.5 to 27.5 |
| 20 | Albany-Schenectady-Troy, NY | 26.6% | 409,630 | 26.3 to 26.9 |
| 21 | Carson City, NV | 26.4% | 24,410 | 25.8 to 27 |
| 22 | Madison, WI | 26.4% | 372,310 | 26 to 26.8 |
| 23 | New York-Newark-Jersey City, NY-NJ | 26.3% | 8,428,030 | 26.1 to 26.6 |
| 24 | Atlanta-Sandy Springs-Roswell, GA | 26.3% | 2,673,490 | 25.8 to 26.7 |
| 25 | Springfield, IL | 26.2% | 88,470 | 25.9 to 26.5 |
| 26 | Minneapolis-St. Paul-Bloomington, MN-WI | 26.1% | 1,731,770 | 25.8 to 26.5 |
| 27 | Charlotte-Concord-Gastonia, NC-SC | 26.1% | 1,275,830 | 25.8 to 26.4 |
| 28 | Tampa-St. Petersburg-Clearwater, FL | 26% | 1,351,550 | 25.6 to 26.4 |
| 29 | Ithaca, NY | 26% | 37,240 | 25.6 to 26.3 |
| 30 | Warner Robins, GA | 25.9% | 63,630 | 25.5 to 26.3 |
| 31 | San Juan-Bayamon-Caguas, PR | 25.7% | 627,240 | 25.1 to 26.2 |
| 32 | Baltimore-Columbia-Towson, MD | 25.6% | 1,226,870 | 25.1 to 26 |
| 33 | Charlottesville, VA | 25.5% | 91,620 | 25.1 to 25.9 |
| 34 | Jefferson City, MO | 25.4% | 67,120 | 25.1 to 25.8 |
| 35 | Dallas-Fort Worth-Arlington, TX | 25.3% | 3,800,140 | 25 to 25.6 |
| 36 | Sacramento-Roseville-Folsom, CA | 25.3% | 950,230 | 24.9 to 25.6 |
| 37 | Santa Fe, NM | 25.2% | 53,140 | 24.6 to 25.8 |
| 38 | Colorado Springs, CO | 25.1% | 282,890 | 24.4 to 25.8 |
| 39 | Richmond, VA | 24.7% | 601,190 | 24.4 to 25 |
| 40 | Jacksonville, FL | 24.6% | 719,180 | 24.3 to 25 |
| 41 | Provo-Orem-Lehi, UT | 24.6% | 275,200 | 24.1 to 25.2 |
| 42 | Elizabethtown, KY | 24.6% | 41,090 | 23.7 to 25.5 |
| 43 | Columbia, SC | 24.5% | 362,080 | 24.1 to 24.8 |
| 44 | Bloomington, IL | 24.4% | 68,270 | 24 to 24.9 |
| 45 | Albuquerque, NM | 24.4% | 357,510 | 23.9 to 24.8 |
| 46 | Palm Bay-Melbourne-Titusville, FL | 24.4% | 226,140 | 23.9 to 24.8 |
| 47 | Phoenix-Mesa-Chandler, AZ | 24.3% | 2,197,210 | 23.9 to 24.7 |
| 48 | Topeka, KS | 24.2% | 101,640 | 23.7 to 24.7 |
| 49 | Miami-Fort Lauderdale-West Palm Beach, FL | 24.2% | 2,595,580 | 23.6 to 24.7 |
| 50 | Ann Arbor, MI | 24.1% | 196,750 | 23.8 to 24.4 |
| 51 | Los Angeles-Long Beach-Anaheim, CA | 24.1% | 5,495,530 | 23.6 to 24.6 |
| 52 | Bridgeport-Stamford-Danbury, CT | 24.1% | 359,170 | 23.5 to 24.7 |
| 53 | Ogden, UT | 24% | 244,240 | 23.4 to 24.5 |
| 54 | Nashville-Davidson--Murfreesboro--Franklin, TN | 23.9% | 1,011,730 | 23.4 to 24.4 |
| 55 | San Antonio-New Braunfels, TX | 23.9% | 1,032,390 | 23.6 to 24.2 |
| 56 | Detroit-Warren-Dearborn, MI | 23.8% | 1,725,390 | 23.4 to 24.1 |
| 57 | Hartford-West Hartford-East Hartford, CT | 23.8% | 539,850 | 23.4 to 24.2 |
| 58 | Manchester-Nashua, NH | 23.7% | 180,210 | 23.2 to 24.1 |
| 59 | Amherst Town-Northampton, MA | 23.6% | 54,000 | 23.2 to 24 |
| 60 | Fort Collins-Loveland, CO | 23.6% | 139,520 | 23 to 24.2 |
| 61 | Midland, MI | 23.6% | 26,610 | 23.1 to 24.1 |
| 62 | Columbia, MO | 23.6% | 93,900 | 23.2 to 24 |
| 63 | Lincoln, NE | 23.6% | 165,630 | 23.2 to 24 |
| 64 | Corvallis, OR | 23.5% | 28,640 | 23 to 24 |
| 65 | Charleston-North Charleston, SC | 23.5% | 362,560 | 23 to 23.9 |
| 66 | Orlando-Kissimmee-Sanford, FL | 23.5% | 1,333,970 | 23.1 to 23.8 |
| 67 | Kansas City, MO-KS | 23.5% | 1,010,030 | 23.1 to 23.8 |
| 68 | Dover, DE | 23.4% | 55,840 | 22.9 to 24 |
| 69 | Columbus, OH | 23.4% | 1,013,660 | 23.1 to 23.7 |
| 70 | Harrisburg-Carlisle, PA | 23.3% | 301,220 | 23 to 23.6 |
| 71 | Salem, OR | 23.3% | 160,630 | 22.9 to 23.7 |
| 72 | Philadelphia-Camden-Wilmington, PA-NJ-DE-MD | 23.3% | 2,602,260 | 23.1 to 23.6 |
| 73 | Milwaukee-Waukesha, WI | 23.2% | 735,010 | 22.9 to 23.6 |
| 74 | Oklahoma City, OK | 23.1% | 639,890 | 22.7 to 23.5 |
| 75 | San Diego-Chula Vista-Carlsbad, CA | 23% | 1,374,490 | 22.6 to 23.3 |
| 76 | El Paso, TX | 23% | 302,780 | 22.6 to 23.3 |
| 77 | Dubuque, IA | 23% | 47,780 | 22.4 to 23.5 |
| 78 | Portland-Vancouver-Hillsboro, OR-WA | 22.9% | 1,089,980 | 22.5 to 23.3 |
| 79 | Oshkosh-Neenah, WI | 22.9% | 78,490 | 22.6 to 23.2 |
| 80 | Chicago-Naperville-Elgin, IL-IN | 22.9% | 4,174,800 | 22.5 to 23.2 |
| 81 | Omaha, NE-IA | 22.9% | 463,540 | 22.5 to 23.3 |
| 82 | Sierra Vista-Douglas, AZ | 22.8% | 27,360 | 22.2 to 23.4 |
| 83 | Albany, GA | 22.7% | 45,980 | 22.2 to 23.3 |
| 84 | Burlington-South Burlington, VT | 22.7% | 102,150 | 22.1 to 23.3 |
| 85 | Rochester, NY | 22.7% | 438,350 | 22.4 to 23 |
| 86 | Lawrence, KS | 22.6% | 42,350 | 22 to 23.2 |
| 87 | Pensacola-Ferry Pass-Brent, FL | 22.6% | 173,680 | 22.2 to 23 |
| 88 | Crestview-Fort Walton Beach-Destin, FL | 22.5% | 115,010 | 21.8 to 23.2 |
| 89 | Abilene, TX | 22.5% | 64,020 | 22.1 to 22.9 |
| 90 | Montgomery, AL | 22.5% | 143,770 | 22.1 to 22.8 |
| 91 | Cincinnati, OH-KY-IN | 22.4% | 1,027,680 | 22.1 to 22.7 |
| 92 | Greenville-Anderson-Greer, SC | 22.3% | 396,560 | 21.9 to 22.7 |
| 93 | St. Louis, MO-IL | 22.3% | 1,216,730 | 21.9 to 22.6 |
| 94 | Columbus, IN | 22.3% | 37,510 | 21.8 to 22.7 |
| 95 | Ames, IA | 22.2% | 45,060 | 21.7 to 22.7 |
| 96 | Cedar Rapids, IA | 22.1% | 123,490 | 21.6 to 22.6 |
| 97 | Fayetteville-Springdale-Rogers, AR | 22.1% | 246,940 | 21.6 to 22.5 |
| 98 | Boise City, ID | 22% | 355,520 | 21.5 to 22.6 |
| 99 | Houston-Pasadena-The Woodlands, TX | 22% | 3,051,510 | 21.7 to 22.3 |
| 100 | Virginia Beach-Chesapeake-Norfolk, VA-NC | 21.9% | 699,820 | 21.6 to 22.3 |
| 101 | Greenville, NC | 21.9% | 69,150 | 21.5 to 22.3 |
| 102 | Peoria, IL | 21.9% | 148,140 | 21.5 to 22.2 |
| 103 | Lexington-Fayette, KY | 21.9% | 256,820 | 21.4 to 22.3 |
| 104 | Dayton-Kettering-Beavercreek, OH | 21.9% | 337,380 | 21.5 to 22.2 |
| 105 | Buffalo-Cheektowaga, NY | 21.8% | 482,640 | 21.5 to 22 |
| 106 | Cleveland, OH | 21.8% | 951,880 | 21.4 to 22.1 |
| 107 | Columbus, GA-AL | 21.7% | 100,770 | 21.4 to 22.1 |
| 108 | Fairbanks-College, AK | 21.7% | 27,100 | 21.2 to 22.3 |
| 109 | Oxnard-Thousand Oaks-Ventura, CA | 21.7% | 279,030 | 21.3 to 22.1 |
| 110 | Tucson, AZ | 21.7% | 350,620 | 21.4 to 22.1 |
| 111 | Las Cruces, NM | 21.7% | 63,390 | 21.2 to 22.2 |
| 112 | Knoxville, TN | 21.6% | 388,200 | 21.3 to 22 |
| 113 | Aguadilla, PR | 21.6% | 38,670 | 20.6 to 22.7 |
| 114 | Bremerton-Silverdale-Port Orchard, WA | 21.6% | 81,660 | 21.2 to 22 |
| 115 | Santa Cruz-Watsonville, CA | 21.6% | 83,740 | 21.2 to 21.9 |
| 116 | Indianapolis-Carmel-Greenwood, IN | 21.5% | 1,024,380 | 21.2 to 21.9 |
| 117 | Pittsburgh, PA | 21.5% | 1,017,970 | 21.1 to 21.8 |
| 118 | Manhattan, KS | 21.4% | 43,070 | 20.9 to 22 |
| 119 | Syracuse, NY | 21.4% | 270,640 | 21.1 to 21.7 |
| 120 | State College, PA | 21.4% | 51,150 | 21 to 21.8 |
| 121 | Logan, UT-ID | 21.4% | 55,680 | 20.9 to 21.8 |
| 122 | Jackson, MI | 21.4% | 42,720 | 20.9 to 21.9 |
| 123 | Fayetteville, NC | 21.4% | 115,160 | 21 to 21.8 |
| 124 | Gainesville, FL | 21.4% | 125,870 | 21 to 21.7 |
| 125 | Bloomington, IN | 21.3% | 57,240 | 20.9 to 21.8 |
| 126 | Greensboro-High Point, NC | 21.3% | 335,080 | 20.9 to 21.7 |
| 127 | Sumter, SC | 21.3% | 25,740 | 20.8 to 21.8 |
| 128 | Winchester, VA-WV | 21.3% | 56,940 | 20.9 to 21.7 |
| 129 | Charleston, WV | 21.3% | 88,560 | 20.8 to 21.7 |
| 130 | Battle Creek, MI | 21.3% | 42,720 | 20.9 to 21.7 |
| 131 | Worcester, MA | 21.3% | 307,500 | 20.9 to 21.6 |
| 132 | Johnson City, TN | 21.3% | 69,520 | 20.8 to 21.7 |
| 133 | Birmingham, AL | 21.2% | 481,260 | 20.8 to 21.6 |
| 134 | San Angelo, TX | 21.2% | 41,560 | 20.8 to 21.6 |
| 135 | New Haven, CT | 21.2% | 241,930 | 20.8 to 21.5 |
| 136 | Eagle Pass, TX | 21.1% | 10,470 | 20.4 to 21.8 |
| 137 | Little Rock-North Little Rock-Conway, AR | 21.1% | 331,620 | 20.7 to 21.5 |
| 138 | Salisbury, MD | 21.1% | 43,450 | 20.6 to 21.6 |
| 139 | Utica-Rome, NY | 21.1% | 97,930 | 20.7 to 21.4 |
| 140 | Tulsa, OK | 21.1% | 427,780 | 20.7 to 21.5 |
| 141 | Saginaw, MI | 21.1% | 66,920 | 20.7 to 21.4 |
| 142 | Chattanooga, TN-GA | 21% | 241,430 | 20.7 to 21.4 |
| 143 | Fargo, ND-MN | 21% | 131,310 | 20.5 to 21.5 |
| 144 | Providence-Warwick, RI-MA | 21% | 640,160 | 20.6 to 21.4 |
| 145 | Kalamazoo-Portage, MI | 21% | 105,570 | 20.6 to 21.4 |
| 146 | Akron, OH | 20.9% | 291,770 | 20.6 to 21.3 |
| 147 | Brownsville-Harlingen, TX | 20.9% | 120,870 | 20.6 to 21.3 |
| 148 | Urban Honolulu, HI | 20.9% | 400,620 | 20.4 to 21.4 |
| 149 | Lubbock, TX | 20.9% | 150,010 | 20.5 to 21.2 |
| 150 | Spokane-Spokane Valley, WA | 20.8% | 224,440 | 20.5 to 21.2 |
| 151 | Davenport-Moline-Rock Island, IA-IL | 20.8% | 159,760 | 20.5 to 21.1 |
| 152 | Roanoke, VA | 20.8% | 133,060 | 20.4 to 21.1 |
| 153 | Waco, TX | 20.6% | 110,320 | 20.3 to 21 |
| 154 | Champaign-Urbana, IL | 20.6% | 89,950 | 20.3 to 21 |
| 155 | McAllen-Edinburg-Mission, TX | 20.6% | 231,310 | 20.3 to 21 |
| 156 | Rochester, MN | 20.6% | 96,850 | 20.3 to 20.9 |
| 157 | Cheyenne, WY | 20.5% | 39,830 | 19.9 to 21.2 |
| 158 | Jacksonville, NC | 20.4% | 43,170 | 19.9 to 21 |
| 159 | Anchorage, AK | 20.4% | 158,300 | 19.9 to 20.9 |
| 160 | Louisville/Jefferson County, KY-IN | 20.4% | 617,920 | 20 to 20.8 |
| 161 | Iowa City, IA | 20.4% | 77,860 | 20 to 20.8 |
| 162 | Savannah, GA | 20.3% | 170,410 | 19.9 to 20.8 |
| 163 | Idaho Falls, ID | 20.3% | 66,990 | 19.8 to 20.9 |
| 164 | Green Bay, WI | 20.3% | 156,590 | 20 to 20.6 |
| 165 | Eugene-Springfield, OR | 20.3% | 135,670 | 19.9 to 20.7 |
| 166 | Asheville, NC | 20.3% | 162,340 | 19.8 to 20.8 |
| 167 | Laredo, TX | 20.2% | 90,710 | 19.5 to 20.9 |
| 168 | Pinehurst-Southern Pines, NC | 20.2% | 35,070 | 19.6 to 20.7 |
| 169 | Springfield, MO | 20.2% | 200,830 | 19.8 to 20.6 |
| 170 | Wilmington, NC | 20.1% | 175,570 | 19.6 to 20.6 |
| 171 | Appleton, WI | 20.1% | 110,050 | 19.7 to 20.5 |
| 172 | Lawton, OK | 20.1% | 34,790 | 19.4 to 20.8 |
| 173 | Grand Rapids-Wyoming-Kentwood, MI | 20.1% | 539,440 | 19.8 to 20.3 |
| 174 | Panama City-Panama City Beach, FL | 20% | 80,990 | 19.6 to 20.5 |
| 175 | Jackson, MS | 20% | 241,680 | 19.6 to 20.5 |
| 176 | Athens-Clarke County, GA | 20% | 76,370 | 19.6 to 20.5 |
| 177 | North Port-Bradenton-Sarasota, FL | 20% | 313,540 | 19.5 to 20.6 |
| 178 | Springfield, MA | 20% | 166,930 | 19.7 to 20.3 |
| 179 | Mankato, MN | 19.9% | 43,070 | 19.4 to 20.4 |
| 180 | St. Cloud, MN | 19.9% | 88,610 | 19.6 to 20.3 |
| 181 | Bismarck, ND | 19.9% | 60,750 | 19.3 to 20.5 |
| 182 | Augusta-Richmond County, GA-SC | 19.9% | 204,840 | 19.6 to 20.1 |
| 183 | Winston-Salem, NC | 19.9% | 243,520 | 19.5 to 20.3 |
| 184 | Memphis, TN-MS-AR | 19.8% | 558,700 | 19.5 to 20.1 |
| 185 | Waterbury-Shelton, CT | 19.8% | 139,450 | 19.4 to 20.2 |
| 186 | Santa Maria-Santa Barbara, CA | 19.8% | 176,620 | 19.5 to 20.2 |
| 187 | Lewiston, ID-WA | 19.8% | 21,000 | 19.2 to 20.4 |
| 188 | Pocatello, ID | 19.8% | 26,860 | 19.3 to 20.3 |
| 189 | Wichita, KS | 19.8% | 280,660 | 19.4 to 20.2 |
| 190 | Ponce, PR | 19.8% | 52,170 | 19.3 to 20.3 |
| 191 | Lakeland-Winter Haven, FL | 19.8% | 240,990 | 19.5 to 20.1 |
| 192 | Eau Claire, WI | 19.7% | 73,570 | 19.4 to 20.1 |
| 193 | Fond du Lac, WI | 19.7% | 34,080 | 19.2 to 20.2 |
| 194 | Lafayette-West Lafayette, IN | 19.7% | 79,820 | 19.3 to 20 |
| 195 | Portland-South Portland, ME | 19.7% | 255,400 | 19.1 to 20.3 |
| 196 | Cape Coral-Fort Myers, FL | 19.7% | 281,730 | 19.1 to 20.2 |
| 197 | Arecibo, PR | 19.6% | 27,750 | 18.8 to 20.5 |
| 198 | Bellingham, WA | 19.6% | 78,320 | 19.2 to 20.1 |
| 199 | South Bend-Mishawaka, IN-MI | 19.6% | 116,720 | 19.3 to 20 |
| 200 | Sioux Falls, SD-MN | 19.6% | 163,450 | 19 to 20.2 |
| 201 | Missoula, MT | 19.6% | 56,180 | 18.9 to 20.3 |
| 202 | Pittsfield, MA | 19.6% | 46,080 | 19.1 to 20 |
| 203 | Macon-Bibb County, GA | 19.6% | 81,780 | 19.1 to 20 |
| 204 | Chico, CA | 19.6% | 61,170 | 19 to 20.1 |
| 205 | Amarillo, TX | 19.5% | 106,600 | 19.1 to 20 |
| 206 | Binghamton, NY | 19.5% | 81,910 | 19.1 to 19.8 |
| 207 | Mayaguez, PR | 19.5% | 43,290 | 18.8 to 20.1 |
| 208 | Baton Rouge, LA | 19.4% | 368,210 | 19.1 to 19.8 |
| 209 | New Orleans-Metairie, LA | 19.4% | 399,720 | 19 to 19.8 |
| 210 | Walla Walla, WA | 19.4% | 17,640 | 18.9 to 19.9 |
| 211 | Sebring, FL | 19.4% | 22,450 | 18.8 to 19.9 |
| 212 | Redding, CA | 19.4% | 56,520 | 19 to 19.8 |
| 213 | Bend, OR | 19.3% | 95,090 | 18.7 to 19.9 |
| 214 | Traverse City, MI | 19.3% | 59,090 | 18.9 to 19.7 |
| 215 | La Crosse-Onalaska, WI-MN | 19.3% | 73,050 | 19 to 19.6 |
| 216 | Santa Rosa-Petaluma, CA | 19.3% | 176,890 | 18.9 to 19.7 |
| 217 | Deltona-Daytona Beach-Ormond Beach, FL | 19.3% | 201,540 | 18.8 to 19.7 |
| 218 | Fort Wayne, IN | 19.3% | 197,210 | 18.9 to 19.6 |
| 219 | Parkersburg-Vienna, WV | 19.2% | 27,600 | 18.6 to 19.8 |
| 220 | Killeen-Temple, TX | 19.2% | 132,750 | 18.8 to 19.6 |
| 221 | Kingsport-Bristol, TN-VA | 19.2% | 104,110 | 18.9 to 19.5 |
| 222 | Mobile, AL | 19.2% | 155,190 | 18.8 to 19.6 |
| 223 | Grand Junction, CO | 19.2% | 56,140 | 18.6 to 19.7 |
| 224 | Greeley, CO | 19.1% | 103,070 | 18.7 to 19.6 |
| 225 | Medford, OR | 19.1% | 75,380 | 18.7 to 19.5 |
| 226 | Blacksburg-Christiansburg-Radford, VA | 19.1% | 53,260 | 18.8 to 19.5 |
| 227 | Wausau, WI | 19.1% | 58,570 | 18.7 to 19.5 |
| 228 | Hinesville, GA | 19.1% | 13,280 | 18.5 to 19.6 |
| 229 | Rocky Mount, NC | 19% | 44,520 | 18.5 to 19.5 |
| 230 | Kiryas Joel-Poughkeepsie-Newburgh, NY | 19% | 236,070 | 18.6 to 19.4 |
| 231 | Slidell-Mandeville-Covington, LA | 19% | 84,090 | 18.4 to 19.6 |
| 232 | Burlington, NC | 19% | 55,600 | 18.5 to 19.4 |
| 233 | Bozeman, MT | 18.9% | 60,530 | 18.2 to 19.7 |
| 234 | Niles, MI | 18.9% | 49,790 | 18.5 to 19.3 |
| 235 | Ocala, FL | 18.9% | 104,910 | 18.5 to 19.3 |
| 236 | Rome, GA | 18.9% | 34,550 | 17.7 to 20.1 |
| 237 | Morgantown, WV | 18.9% | 55,540 | 18.3 to 19.4 |
| 238 | College Station-Bryan, TX | 18.8% | 111,690 | 18.5 to 19.2 |
| 239 | Punta Gorda, FL | 18.8% | 48,010 | 18.3 to 19.4 |
| 240 | Racine-Mount Pleasant, WI | 18.8% | 62,150 | 18.4 to 19.2 |
| 241 | Billings, MT | 18.8% | 81,360 | 18.2 to 19.4 |
| 242 | Muncie, IN | 18.8% | 35,280 | 18.3 to 19.2 |
| 243 | Hilton Head Island-Bluffton-Port Royal, SC | 18.8% | 73,960 | 18.2 to 19.4 |
| 244 | Hagerstown-Martinsburg, MD-WV | 18.8% | 93,720 | 18.4 to 19.2 |
| 245 | Florence, SC | 18.8% | 76,690 | 18.4 to 19.1 |
| 246 | San Luis Obispo-Paso Robles, CA | 18.7% | 104,700 | 18.4 to 19.1 |
| 247 | Elmira, NY | 18.7% | 25,980 | 18.2 to 19.2 |
| 248 | Lynchburg, VA | 18.7% | 82,180 | 18.3 to 19.2 |
| 249 | Erie, PA | 18.7% | 100,780 | 18.4 to 19 |
| 250 | Williamsport, PA | 18.6% | 38,910 | 18.2 to 19.1 |
| 251 | Gainesville, GA | 18.6% | 86,340 | 18.2 to 19 |
| 252 | Janesville-Beloit, WI | 18.6% | 59,240 | 18.2 to 19 |
| 253 | Reno, NV | 18.6% | 247,240 | 18.1 to 19.1 |
| 254 | Sebastian-Vero Beach-West Vero Corridor, FL | 18.5% | 50,030 | 18 to 19.1 |
| 255 | Brunswick-St. Simons, GA | 18.5% | 37,910 | 18.1 to 19 |
| 256 | Clarksville, TN-KY | 18.5% | 87,760 | 18.1 to 18.8 |
| 257 | Auburn-Opelika, AL | 18.4% | 59,060 | 17.9 to 18.9 |
| 258 | Kennewick-Richland, WA | 18.4% | 110,760 | 18.1 to 18.7 |
| 259 | Evansville, IN | 18.4% | 120,930 | 18 to 18.8 |
| 260 | Reading, PA | 18.3% | 151,570 | 18 to 18.7 |
| 261 | Bangor, ME | 18.3% | 61,350 | 17.9 to 18.7 |
| 262 | Port St. Lucie, FL | 18.3% | 153,770 | 17.8 to 18.8 |
| 263 | Yuma, AZ | 18.3% | 58,750 | 17.8 to 18.8 |
| 264 | Duluth, MN-WI | 18.3% | 106,660 | 18 to 18.6 |
| 265 | Allentown-Bethlehem-Easton, PA-NJ | 18.3% | 341,600 | 18 to 18.5 |
| 266 | St. George, UT | 18.2% | 79,080 | 17.6 to 18.8 |
| 267 | Victoria, TX | 18.2% | 31,040 | 17.6 to 18.8 |
| 268 | Wichita Falls, TX | 18.2% | 45,200 | 17.8 to 18.6 |
| 269 | Dalton, GA | 18.2% | 55,610 | 17.6 to 18.8 |
| 270 | Monroe, LA | 18.2% | 70,950 | 17.7 to 18.6 |
| 271 | Tyler, TX | 18.1% | 97,010 | 17.7 to 18.4 |
| 272 | Harrisonburg, VA | 18.1% | 53,790 | 17.5 to 18.6 |
| 273 | Naples-Marco Island, FL | 18% | 158,680 | 17.5 to 18.5 |
| 274 | Wildwood-The Villages, FL | 18% | 33,880 | 17.5 to 18.6 |
| 275 | Shreveport-Bossier City, LA | 18% | 144,240 | 17.6 to 18.4 |
| 276 | Spartanburg, SC | 18% | 139,300 | 17.7 to 18.3 |
| 277 | Flint, MI | 18% | 112,960 | 17.6 to 18.4 |
| 278 | Corpus Christi, TX | 18% | 170,550 | 17.6 to 18.3 |
| 279 | Kingston, NY | 17.9% | 48,090 | 17.4 to 18.4 |
| 280 | Fresno, CA | 17.9% | 412,410 | 17.5 to 18.4 |
| 281 | Glens Falls, NY | 17.8% | 41,130 | 17.4 to 18.3 |
| 282 | Lancaster, PA | 17.8% | 222,720 | 17.5 to 18.1 |
| 283 | Las Vegas-Henderson-North Las Vegas, NV | 17.8% | 1,067,080 | 17.4 to 18.3 |
| 284 | Longview, TX | 17.8% | 102,180 | 17.4 to 18.1 |
| 285 | Prescott Valley-Prescott, AZ | 17.8% | 62,320 | 17.2 to 18.3 |
| 286 | Cleveland, TN | 17.8% | 33,130 | 17.2 to 18.3 |
| 287 | Coeur d'Alene, ID | 17.8% | 61,000 | 17.2 to 18.3 |
| 288 | Waterloo-Cedar Falls, IA | 17.8% | 71,540 | 17.3 to 18.2 |
| 289 | Alexandria, LA | 17.7% | 47,610 | 17.3 to 18.2 |
| 290 | Yuba City, CA | 17.7% | 39,630 | 17 to 18.5 |
| 291 | Barnstable Town, MA | 17.7% | 82,710 | 17.1 to 18.4 |
| 292 | Goldsboro, NC | 17.7% | 31,650 | 17.2 to 18.1 |
| 293 | Scranton--Wilkes-Barre, PA | 17.7% | 224,190 | 17.3 to 18 |
| 294 | Lafayette, LA | 17.6% | 152,170 | 17.1 to 18.2 |
| 295 | Hattiesburg, MS | 17.6% | 51,590 | 17.2 to 18.1 |
| 296 | Midland, TX | 17.6% | 109,700 | 17.1 to 18.2 |
| 297 | Sheboygan, WI | 17.6% | 50,270 | 17.2 to 18 |
| 298 | Watertown-Fort Drum, NY | 17.5% | 31,310 | 17.1 to 18 |
| 299 | Cape Girardeau, MO-IL | 17.5% | 34,750 | 17.1 to 18 |
| 300 | Norwich-New London-Willimantic, CT | 17.5% | 101,700 | 17.2 to 17.9 |
| 301 | Pueblo, CO | 17.5% | 50,630 | 17 to 18 |
| 302 | Guayama, PR | 17.5% | 7,490 | 16.6 to 18.4 |
| 303 | Vallejo, CA | 17.5% | 119,920 | 17.2 to 17.8 |
| 304 | Great Falls, MT | 17.4% | 28,920 | 16.9 to 18 |
| 305 | Rapid City, SD | 17.4% | 66,260 | 16.8 to 18 |
| 306 | Lake Havasu City-Kingman, AZ | 17.4% | 48,750 | 16.9 to 17.9 |
| 307 | Lewiston-Auburn, ME | 17.4% | 38,540 | 16.9 to 17.9 |
| 308 | Elkhart-Goshen, IN | 17.4% | 99,430 | 17.1 to 17.8 |
| 309 | Johnstown, PA | 17.4% | 38,890 | 16.9 to 17.9 |
| 310 | Kenosha, WI | 17.4% | 65,080 | 17 to 17.8 |
| 311 | Altoona, PA | 17.4% | 48,790 | 16.9 to 17.8 |
| 312 | York-Hanover, PA | 17.3% | 163,440 | 17 to 17.6 |
| 313 | Canton-Massillon, OH | 17.3% | 144,180 | 16.9 to 17.6 |
| 314 | Valdosta, GA | 17.3% | 44,670 | 16.9 to 17.7 |
| 315 | Decatur, AL | 17.3% | 50,130 | 16.9 to 17.7 |
| 316 | Myrtle Beach-Conway-North Myrtle Beach, SC | 17.2% | 131,850 | 16.8 to 17.7 |
| 317 | Toledo, OH | 17.2% | 260,550 | 16.9 to 17.5 |
| 318 | Hickory-Lenoir-Morganton, NC | 17.2% | 137,090 | 16.9 to 17.5 |
| 319 | Homosassa Springs, FL | 17.2% | 28,420 | 16.6 to 17.8 |
| 320 | Tuscaloosa, AL | 17.2% | 85,820 | 16.8 to 17.6 |
| 321 | Fort Smith, AR-OK | 17.1% | 82,790 | 16.7 to 17.6 |
| 322 | Rockford, IL | 17% | 122,620 | 16.7 to 17.4 |
| 323 | Bay City, MI | 17% | 25,860 | 16.5 to 17.5 |
| 324 | Beaumont-Port Arthur, TX | 17% | 146,740 | 16.7 to 17.3 |
| 325 | Huntington-Ashland, WV-KY-OH | 17% | 124,280 | 16.6 to 17.3 |
| 326 | Dothan, AL | 17% | 51,950 | 16.5 to 17.4 |
| 327 | Grand Forks, ND-MN | 16.9% | 41,850 | 16.5 to 17.3 |
| 328 | Mount Vernon-Anacortes, WA | 16.9% | 43,350 | 16.6 to 17.3 |
| 329 | Sherman-Denison, TX | 16.9% | 42,480 | 16.4 to 17.4 |
| 330 | Minot, ND | 16.9% | 25,760 | 16.4 to 17.5 |
| 331 | Anniston-Oxford, AL | 16.9% | 34,580 | 16.5 to 17.3 |
| 332 | Flagstaff, AZ | 16.9% | 55,640 | 16.5 to 17.3 |
| 333 | Owensboro, KY | 16.9% | 40,290 | 16.4 to 17.4 |
| 334 | Jackson, TN | 16.8% | 70,250 | 16.4 to 17.2 |
| 335 | Gulfport-Biloxi, MS | 16.8% | 142,550 | 16.4 to 17.2 |
| 336 | Chambersburg, PA | 16.8% | 50,980 | 16.3 to 17.2 |
| 337 | Atlantic City-Hammonton, NJ | 16.7% | 151,550 | 16.4 to 17.1 |
| 338 | Bowling Green, KY | 16.7% | 70,640 | 16.2 to 17.2 |
| 339 | Grants Pass, OR | 16.7% | 18,870 | 16.2 to 17.2 |
| 340 | Springfield, OH | 16.7% | 37,050 | 16.3 to 17.1 |
| 341 | Monroe, MI | 16.7% | 32,280 | 16.2 to 17.1 |
| 342 | Longview-Kelso, WA | 16.5% | 31,810 | 16 to 17.1 |
| 343 | Enid, OK | 16.5% | 17,130 | 15.8 to 17.2 |
| 344 | Daphne-Fairhope-Foley, AL | 16.5% | 77,160 | 16 to 17 |
| 345 | Farmington, NM | 16.5% | 38,740 | 16 to 17 |
| 346 | Texarkana, TX-AR | 16.4% | 47,790 | 16.1 to 16.8 |
| 347 | Paducah, KY-IL | 16.4% | 41,840 | 15.9 to 16.9 |
| 348 | Morristown, TN | 16.3% | 36,890 | 15.8 to 16.8 |
| 349 | Stockton-Lodi, CA | 16.3% | 236,730 | 16 to 16.6 |
| 350 | Staunton-Stuarts Draft, VA | 16.3% | 39,870 | 15.9 to 16.7 |
| 351 | Decatur, IL | 16.2% | 33,980 | 15.8 to 16.7 |
| 352 | Riverside-San Bernardino-Ontario, CA | 16.2% | 1,504,530 | 16 to 16.5 |
| 353 | Joplin, MO-KS | 16.2% | 71,510 | 15.8 to 16.6 |
| 354 | Casper, WY | 16.1% | 31,270 | 15.6 to 16.7 |
| 355 | Grand Island, NE | 16.1% | 30,170 | 15.7 to 16.6 |
| 356 | St. Joseph, MO-KS | 16% | 44,910 | 15.6 to 16.4 |
| 357 | Florence-Muscle Shoals, AL | 16% | 46,050 | 15.6 to 16.5 |
| 358 | El Centro, CA | 15.9% | 47,240 | 15.6 to 16.3 |
| 359 | Muskegon-Norton Shores, MI | 15.9% | 49,780 | 15.6 to 16.3 |
| 360 | Kokomo, IN | 15.8% | 24,560 | 15.4 to 16.2 |
| 361 | Napa, CA | 15.8% | 66,140 | 15.3 to 16.3 |
| 362 | Twin Falls, ID | 15.8% | 41,300 | 15.3 to 16.3 |
| 363 | Houma-Bayou Cane-Thibodaux, LA | 15.8% | 70,960 | 15.3 to 16.3 |
| 364 | Sioux City, IA-NE-SD | 15.8% | 63,650 | 15.4 to 16.1 |
| 365 | Bakersfield-Delano, CA | 15.8% | 293,530 | 15.5 to 16.1 |
| 366 | Lima, OH | 15.7% | 41,030 | 15.4 to 16.1 |
| 367 | Hammond, LA | 15.7% | 36,620 | 15.2 to 16.2 |
| 368 | Youngstown-Warren, OH | 15.6% | 141,080 | 15.2 to 16 |
| 369 | Albany, OR | 15.6% | 37,180 | 15.2 to 16 |
| 370 | Modesto, CA | 15.6% | 168,130 | 15.3 to 15.9 |
| 371 | Terre Haute, IN | 15.5% | 53,860 | 15.2 to 15.9 |
| 372 | Kahului-Wailuku, HI | 15.5% | 64,940 | 15 to 16 |
| 373 | Hot Springs, AR | 15.5% | 31,570 | 15 to 16 |
| 374 | Gadsden, AL | 15.4% | 25,630 | 14.9 to 15.9 |
| 375 | Mansfield, OH | 15.4% | 39,680 | 15 to 15.8 |
| 376 | Odessa, TX | 15.4% | 70,660 | 14.9 to 15.8 |
| 377 | Vineland, NJ | 15.3% | 50,260 | 15 to 15.7 |
| 378 | Kankakee, IL | 15.3% | 33,650 | 14.9 to 15.7 |
| 379 | Lebanon, PA | 15.3% | 43,080 | 14.9 to 15.6 |
| 380 | Beckley, WV | 15.3% | 34,900 | 14.7 to 15.8 |
| 381 | Jonesboro, AR | 15.2% | 52,050 | 14.9 to 15.6 |
| 382 | Wenatchee-East Wenatchee, WA | 15.2% | 43,380 | 14.8 to 15.6 |
| 383 | Wheeling, WV-OH | 15.2% | 49,740 | 14.8 to 15.5 |
| 384 | Yakima, WA | 15.1% | 80,980 | 14.7 to 15.5 |
| 385 | Gettysburg, PA | 14.9% | 25,130 | 14.5 to 15.3 |
| 386 | Michigan City-La Porte, IN | 14.6% | 32,070 | 14.2 to 14.9 |
| 387 | Sandusky, OH | 14.4% | 40,680 | 14.1 to 14.8 |
| 388 | Weirton-Steubenville, WV-OH | 14.2% | 28,530 | 13.8 to 14.7 |
| 389 | Merced, CA | 14.1% | 63,340 | 13.7 to 14.5 |
| 390 | Hanford-Corcoran, CA | 14.1% | 34,930 | 13.7 to 14.5 |
| 391 | Lake Charles, LA | 14% | 87,380 | 13.6 to 14.5 |
| 392 | Salinas, CA | 13.8% | 162,740 | 13.5 to 14.1 |
| 393 | Visalia, CA | 13.2% | 147,390 | 12.8 to 13.5 |
States and territories
| Rank | Place | Highly exposed / matched jobs (%) | Matched jobs (n) | Approximate 95% interval |
|---|---|---|---|---|
| 1 | District of Columbia | 38.3% | 651,360 | 37.6 to 39.1 |
| 2 | Massachusetts | 26.1% | 3,316,400 | 25.8 to 26.4 |
| 3 | Colorado | 25.9% | 2,665,660 | 25.5 to 26.3 |
| 4 | Virginia | 25.8% | 3,820,920 | 25.6 to 26.1 |
| 5 | New York | 25.8% | 8,603,430 | 25.5 to 26 |
| 6 | Maryland | 25.8% | 2,544,030 | 25.4 to 26.1 |
| 7 | Washington | 24.8% | 3,248,880 | 24.4 to 25.2 |
| 8 | Delaware | 24.7% | 436,680 | 24.2 to 25.2 |
| 9 | New Jersey | 24.5% | 3,940,570 | 24.2 to 24.9 |
| 10 | Georgia | 24.5% | 4,511,550 | 24.2 to 24.8 |
| 11 | North Carolina | 24.5% | 4,635,580 | 24.2 to 24.7 |
| 12 | Florida | 24.4% | 9,361,590 | 24.2 to 24.6 |
| 13 | Minnesota | 24.4% | 2,632,090 | 24.1 to 24.7 |
| 14 | Utah | 24.2% | 1,592,430 | 23.9 to 24.5 |
| 15 | Puerto Rico | 23.8% | 856,900 | 23.4 to 24.3 |
| 16 | Texas | 23.7% | 13,119,130 | 23.5 to 23.9 |
| 17 | California | 23.5% | 16,239,170 | 23.3 to 23.7 |
| 18 | Rhode Island | 23.4% | 446,460 | 22.8 to 23.9 |
| 19 | Arizona | 23.3% | 3,004,780 | 23 to 23.7 |
| 20 | New Hampshire | 22.7% | 628,150 | 22.3 to 23.2 |
| 21 | Illinois | 22.7% | 5,636,790 | 22.4 to 23 |
| 22 | Michigan | 22.4% | 4,021,580 | 22.2 to 22.7 |
| 23 | Connecticut | 22.4% | 1,534,040 | 22.1 to 22.7 |
| 24 | South Carolina | 22.2% | 2,143,360 | 21.9 to 22.4 |
| 25 | New Mexico | 22.1% | 789,200 | 21.8 to 22.4 |
| 26 | Wisconsin | 22% | 2,685,750 | 21.8 to 22.2 |
| 27 | Pennsylvania | 22% | 5,525,580 | 21.8 to 22.2 |
| 28 | Tennessee | 22% | 3,031,930 | 21.7 to 22.3 |
| 29 | Nebraska | 21.8% | 960,220 | 21.5 to 22.1 |
| 30 | Oregon | 21.8% | 1,781,150 | 21.5 to 22.1 |
| 31 | Missouri | 21.8% | 2,685,870 | 21.5 to 22.1 |
| 32 | Ohio | 21.4% | 5,143,030 | 21.2 to 21.6 |
| 33 | Kansas | 21.3% | 1,327,490 | 20.9 to 21.6 |
| 34 | Oklahoma | 20.9% | 1,617,570 | 20.6 to 21.2 |
| 35 | Idaho | 20.6% | 789,810 | 20.2 to 21 |
| 36 | Iowa | 20.6% | 1,434,530 | 20.3 to 20.9 |
| 37 | Vermont | 20.5% | 264,520 | 20 to 20.9 |
| 38 | Alabama | 20.2% | 1,949,230 | 20 to 20.5 |
| 39 | Virgin Islands | 20% | 26,040 | 19.3 to 20.7 |
| 40 | Kentucky | 20% | 1,838,740 | 19.7 to 20.3 |
| 41 | Guam | 19.9% | 56,300 | 19.3 to 20.5 |
| 42 | Maine | 19.9% | 581,030 | 19.4 to 20.3 |
| 43 | Alaska | 19.4% | 295,280 | 19 to 19.8 |
| 44 | Indiana | 19.3% | 2,941,870 | 19.1 to 19.6 |
| 45 | Hawaii | 19.3% | 575,300 | 18.9 to 19.7 |
| 46 | Arkansas | 19.2% | 1,213,370 | 18.8 to 19.5 |
| 47 | Montana | 19.1% | 468,150 | 18.8 to 19.5 |
| 48 | Nevada | 18.4% | 1,452,610 | 18 to 18.7 |
| 49 | South Dakota | 18.3% | 430,740 | 17.9 to 18.6 |
| 50 | Louisiana | 18.3% | 1,767,640 | 18 to 18.5 |
| 51 | North Dakota | 18.1% | 392,550 | 17.8 to 18.5 |
| 52 | West Virginia | 17.9% | 646,690 | 17.6 to 18.2 |
| 53 | Mississippi | 17.4% | 1,065,320 | 17.1 to 17.7 |
| 54 | Wyoming | 16.6% | 257,010 | 16.2 to 17 |
No reportable match. Try a shorter name or switch geography.
At least 60% of known employment must match an exposure score. Highly exposed means a mean human-rated beta score of at least 0.5. Rankings use the point estimate, not a test of differences.
01
THE FINDING
AND ITS MEANING
Change the score, and the local order moves.
Under the human-rated score, Olympia-Lacey-Tumwater is No. 2. Under GPT-4's rating, it is No. 16. Boulder moves from No. 5 to No. 2. The jobs stay the same. Only the exposure scores do.
College Station-Bryan shifts from rank 238 to 79. Its employment count hasn't changed. Its rating has.
This is a warning about precision, not a new forecast.
Across 393 metros, the Spearman rank correlation is 0.97, so the broad ordering is similar. But a reporter's local story usually turns on particular places, where movement can be more visible.
We wouldn't call a place more vulnerable because it sits one row higher. Close estimates can overlap, and a different defensible score changes the order.
Source records and definitions ↗Same jobs. Different exposure ratings.
Olympia-Lacey-Tumwater, WA
Human-rated rank#2
GPT-4-rated rank#16
Source: Primary: 32.0% (approximate 95% interval 31.6 to 32.4%); sensitivity: 34.5%. Matched jobs: 115,100.
Boulder, CO
Human-rated rank#5
GPT-4-rated rank#2
Source: Primary: 31.7% (approximate 95% interval 31 to 32.5%); sensitivity: 41.8%. Matched jobs: 170,070.
College Station-Bryan, TX
Human-rated rank#238
GPT-4-rated rank#79
Source: Primary: 18.8% (approximate 95% interval 18.5 to 19.2%); sensitivity: 28.1%. Matched jobs: 111,690.
May 2025 OEWS employment with 2023 exposure ratings. Rank 1 means the highest share among 393 reportable metros. We don't have an interval for the sensitivity ranks. They aren't tests of significance.
02
THE FINDING
AND ITS MEANING
The denominator is part of the story.
We could match 92.5% of 155,481,840 known US jobs to an exposure score. We don't count suppressed employment as known. Unmatched occupations stay outside the headline base.
In Boulder, the primary share is 31.7% of matched jobs, with an approximate 95% interval of 31 to 32.5%. The same exposed-job count is 29.8% of all known jobs. Its coverage is 93.8%, with 170,070 matched jobs.
The missing jobs matter.
We haven't scored them as safe. Boulder's two shares show what happens when we change the base, not two forecasts of layoffs. Our local records show coverage so readers can see how much of the known workforce sits behind the headline.
Source records and definitions ↗Our interpretation and the next reporting questionsWhat the evidence suggests, alternative explanations, and checks not yet performed.
How to turn exposure into evidence.
Our reading of the evidence, not an additional measured result.
Start in Boulder with one practical question: what happened to the time saved? Faster drafting could expand output, raise quality, cut overtime, shift staff, or mean fewer hires than last year.
A staffing change could also come from demand, funding, mergers, turnover or measurement. The 2023 exposure score can't tell those paths apart.
The 2023 scores can't answer for today's workplace.
Our comparison gives readers a test for confident headlines. Olympia moves from rank 2 to 16 when the rating changes, yet its employment record stays fixed. Before reporting a local effect, we'd want task-level evidence of what changed, who gained time, and what the employer did next.
Without that, the story misleads. Workers may read a probability of replacement the source never measured; employers may hear occupational averages presented as a forecast.
What to investigate next
Open questions for further reporting. These aren't findings or interviews we claim to have completed.
- Interview matched employers and workers in one metro: which tasks changed since 2023, whether AI was involved, and what happened to time saved.
- Compare the reported rank with both exposure scores, the matched-job coverage and the interval before quoting it.
- Follow staffing, output, quality and pay over time; the score alone can't tell reinvestment, monitoring, a hiring freeze or displacement apart.
Behind the analysis
Inspect the source records 5 records / definitions / provenance
We link every comparison to the records used. Open the provenance download to check the selected values and the source-file checksums. Interpretation stays separate from those measured results.
- Source: E1
findings.jsonSource: id: OEWS-08
- Source: E2
tables/geo_national.csvSource: level: national / CSV line 2
- Source: E3
tables/geo_metro.csvSource: area_code: 36500 / CSV line 3
- Source: E4
tables/geo_metro.csvSource: area_code: 14500 / CSV line 6
- Source: E5
tables/geo_metro.csvSource: area_code: 17780 / CSV line 239
The leading places.
The defined measure.
Different places have different mixes of occupations. This study joins those employment counts to task-exposure scores. The result describes the mix of work, not what employers plan to do.
Dots show the reported value. Lines show the approximate 95% interval. A rank isn't a test of differences.
Source: BLS OEWS and Eloundou et al.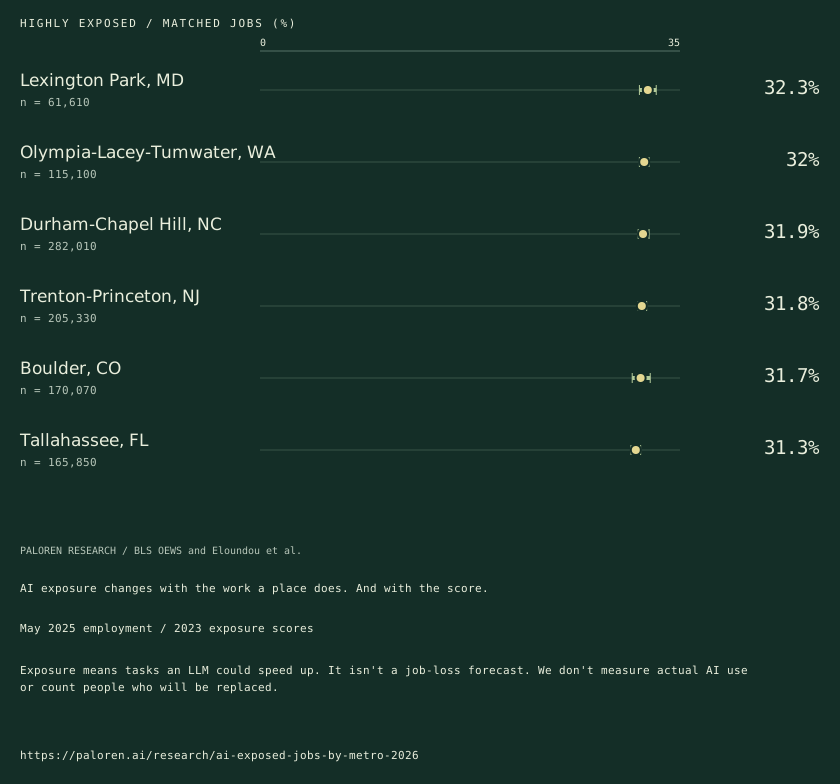
Reporter notes: explanations, unknowns and citationDownload the full briefing or inspect the sources and methods.
The finding.
The meaning.
The next question.
Where do task-exposure scores put more jobs in the highly exposed group, and how much does the chosen score change the answer?
Download reporter brief ↓Editorial edition / 26 October 202623.2% of matched US jobs in highly exposed occupations. Approximate 95% interval: 23.1% to 23.2%. Matched employment: n = 143,751,120. Source period: May 2025 employment / 2023 exposure scores.
Exposure means tasks an LLM could speed up. It isn't a job-loss forecast. We don't measure actual AI use or count people who will be replaced. At least 60% of known employment must match an exposure score. Highly exposed means a mean human-rated beta score of at least 0.5. Rankings use the point estimate, not a test of differences.
Start in Boulder with one practical question: what happened to the time saved? Faster drafting could expand output, raise quality, cut overtime, shift staff, or mean fewer hires than last year. A staffing change could also come from demand, funding, mergers, turnover or measurement. The 2023 exposure score can't tell those paths apart.
Other explanations and what we cannot answer
- Different occupation mixes can produce different exposure shares without different adoption rates.
- Changing the exposure rating changes some local ranks even when the employment records stay fixed.
Our comparison gives readers a test for confident headlines. Olympia moves from rank 2 to 16 when the rating changes, yet its employment record stays fixed. Before reporting a local effect, we'd want task-level evidence of what changed, who gained time, and what the employer did next.
Where the reporting goes next
- Interview matched employers and workers in one metro: which tasks changed since 2023, whether AI was involved, and what happened to time saved.
- Compare the reported rank with both exposure scores, the matched-job coverage and the interval before quoting it.
- Follow staffing, output, quality and pay over time; the score alone can't tell reinvestment, monitoring, a hiring freeze or displacement apart.
We haven't done these checks yet. They're a route for further reporting, not extra findings.
Sources, methods and citation
- BLS OEWS and Eloundou et al. ↗
- Occupation exposure scores ↗
- Source-linked local data and study method ↗
No one was interviewed for this brief, and no cause was tested.
We updated this brief on 26 October 2026. We haven't refreshed the data. Use the period beside the finding.
Copyable citation
Paloren Research. Which places have the most work exposed to AI?. Editorial edition 26 October 2026. https://paloren.ai/research/ai-exposed-jobs-by-metro-2026
Use our analysis with credit to Paloren Research and a link. Don't drop the caveats. We can't grant rights to a source publisher's material.
Request comment or a correction ↗Method and limitationsDefinitions, exclusions, source records and the checks behind this edition.
What this can
and cannot say.
At least 60% of known employment must match an exposure score. Highly exposed means a mean human-rated beta score of at least 0.5. Rankings use the point estimate, not a test of differences.
Open the primary source ↗Occupation exposure scores ↗
- 01
We count matched jobs. If an occupation has no usable score, or BLS suppresses its employment, we don't treat those missing workers as unexposed. Each local record shows how much of the known job base we could match.
- 02
The scores date to 2023. They aren't a test of today's tools.
- 03
We use BLS employment errors to form an approximate 95% range. It assumes the cells are independent, which may not hold. That range doesn't test the exposure score itself. Self-employed workers aren't in OEWS.
Leave with the record.
Keep the definition, period and qualification with any figure you reuse. The download includes the local facts supplied by the study, source-row references and reporting rules.
Request comment or a source check ↗How to read
our research.
Original analysis, with the evidence and its limits kept together.
Publisher and methods
We're part of Paloren, an AI consultancy and commercial publisher. We don't claim to be an independent research institution.
We show what we counted, then explain our reading of it. They're different. An AI name isn't proof of an AI business; a filing's warning isn't an incident report.
Corrections and version history 26 October 2026
We changed the articles on 26 October 2026, not the source data. Edition newsroom-20261026.
- Copy edit / 28 October 2026 / Research copy notes
We made copy edits for clarity and consistency. Methods, findings and figures have not changed.
- Reading and presentation update / All ten studies
The opening links to the downloadable briefing. Local tables come first. You can expand secondary detail or print the study, keeping the source notes and caveats beside the results so they don't get lost when you share a finding. Source values are unchanged. We also corrected punctuation and displayed council-record grammar.
- Editorial update / All ten studies
Each of the ten studies now has a brief. It sets out what we found, our take, and what we'd need to check next. The datasets haven't been refreshed.
We keep each source period beside its finding. We haven't set a schedule for new data releases.
Reuse and corrections
Use our original charts and analysis with credit to Paloren Research and a link. Keep the source period and caveats. We can't grant rights to material owned by a source publisher.
Found a mistake? Send us the page and the record we should check at aaron@palorenresearch.com.
For a quote from Aaron, please ask for a current comment. Our labelled analysis isn't a spoken quotation.
Infrastructure / United StatesThe hosting boom is bigger than the data-centre count.↗Company registers / United KingdomLondon has an AI-name cluster. It is not yet an industry map.↗Business registers / AustraliaNSW leads one AI-register measure. The ACT leads another.↗
All local investigations ↗Research
Local investigations
Media
Paloren

A finding is a starting point. Bring it to Paloren and we will test what it means for your business.
Talk to Paloren