

THE PUBLIC RECORD / PALORENFIELD NOTES / 15
US colleges reported 1,616 awards under the dedicated AI programme code in 2023, up from 389 in 2020. Most are master's awards, and the count excludes AI teaching in broader computer-science programmes.
1,616
reported AI awards in 2023
389 awards in 2020. Counts cover CIP 11.0102 and include degrees and certificates.2020 to 2023 / latest year analysed: 2023READ THIS WITH THE NUMBER
This counts the AI programme code CIP 11.0102, not all AI teaching. Awards include certificates as well as degrees.
Analysis by
Paloren Research
What we set out to find.
We compared US college awards under the AI programme code, CIP 11.0102, from 2020 to 2023. Which courses grew? We broke the count down by award level and campus location to see what sits behind the national total.
What we found
Awards rose from 389 to 1,616. Most weren't undergraduate degrees. In 2023, 1,122 were master's awards, so a headline about a new undergraduate workforce would miss the largest part of the count.
How we did it, and what it cannot tell us ↗Find your place.
Take the evidence.
We've made 34 reportable states and dc searchable. Start with a name. We keep the count and caveat beside each finding so you can check what you're quoting. A missing place isn't a zero.
States and DC
| Rank | Place | AI awards / 100,000 residents | Resident population (2023) |
|---|---|---|---|
| 1 | Pennsylvania | 2.74 | 13,017,721 |
| 2 | District of Columbia | 2.47 | 687,324 |
| 3 | Massachusetts | 2.18 | 7,066,568 |
| 4 | Maryland | 1.21 | 6,217,062 |
| 5 | Missouri | 1.05 | 6,208,038 |
| 6 | Illinois | 0.94 | 12,642,259 |
| 7 | South Dakota | 0.87 | 918,305 |
| 8 | Connecticut | 0.71 | 3,643,023 |
| 9 | California | 0.53 | 39,198,693 |
| 10 | Arizona | 0.51 | 7,473,027 |
| 11 | Wisconsin | 0.51 | 5,930,405 |
| 12 | Florida | 0.46 | 22,904,868 |
| 13 | Washington | 0.43 | 7,857,320 |
| 14 | New Mexico | 0.42 | 2,121,164 |
| 15 | Maine | 0.36 | 1,399,646 |
| 16 | Texas | 0.35 | 30,727,890 |
| 17 | Michigan | 0.34 | 10,083,356 |
| 18 | New York | 0.34 | 19,737,367 |
| 19 | Ohio | 0.34 | 11,824,034 |
| 20 | North Carolina | 0.25 | 10,881,189 |
| 21 | Iowa | 0.22 | 3,218,414 |
| 22 | Oregon | 0.21 | 4,253,653 |
| 23 | Utah | 0.2 | 3,443,222 |
| 24 | Indiana | 0.19 | 6,880,131 |
| 25 | Minnesota | 0.19 | 5,753,048 |
| 26 | Montana | 0.18 | 1,131,302 |
| 27 | New Jersey | 0.15 | 9,379,642 |
| 28 | Georgia | 0.12 | 11,064,432 |
| 29 | Colorado | 0.1 | 5,901,339 |
| 30 | South Carolina | 0.04 | 5,387,830 |
| 31 | Tennessee | 0.04 | 7,148,304 |
| 32 | Alabama | 0.02 | 5,117,673 |
| 33 | Kentucky | 0.02 | 4,550,595 |
| 34 | Oklahoma | 0.02 | 4,063,882 |
Institutions
| Rank | Place | AI awards in 2023 | Reported AI awards (n) |
|---|---|---|---|
| Carnegie Mellon University, Pittsburgh, PA | 227 | 227 | |
| University of Pennsylvania, Philadelphia, PA | 87 | 87 | |
| Illinois Institute of Technology, Chicago, IL | 74 | 74 | |
| San Jose State University, San Jose, CA | 69 | 69 | |
| University of North Texas, Denton, TX | 69 | 69 | |
| Johns Hopkins University, Baltimore, MD | 62 | 62 | |
| Florida Atlantic University, Boca Raton, FL | 60 | 60 | |
| Northeastern University, Boston, MA | 58 | 58 | |
| University of San Diego, San Diego, CA | 50 | 50 | |
| University of Southern California, Los Angeles, CA | 40 | 40 | |
| Boston University, Boston, MA | 38 | 38 | |
| Massachusetts Institute of Technology, Cambridge, MA | 35 | 35 | |
| Northwestern University, Evanston, IL | 35 | 35 | |
| Gannon University, Erie, PA | 31 | 31 | |
| University of Missouri-St Louis, Saint Louis, MO | 31 | 31 | |
| Milwaukee School of Engineering, Milwaukee, WI | 30 | 30 | |
| University of Washington-Seattle Campus, Seattle, WA | 29 | 29 | |
| University of California-Santa Cruz, Santa Cruz, CA | 28 | 28 | |
| University of Bridgeport, Bridgeport, CT | 26 | 26 | |
| The University of Texas at San Antonio, San Antonio, TX | 25 | 25 | |
| Brandeis University, Waltham, MA | 23 | 23 | |
| Yeshiva University, New York, NY | 23 | 23 | |
| Rochester Institute of Technology, Rochester, NY | 22 | 22 | |
| University of Michigan-Dearborn, Dearborn, MI | 22 | 22 | |
| Naval Postgraduate School, Monterey, CA | 20 | 20 | |
| University of Cincinnati-Main Campus, Cincinnati, OH | 20 | 20 |
No reportable match. Try a shorter name or switch geography.
State rows need at least one institution reporting a primary-code award in 2023. Institution rows need at least 20 awards. Counts include first majors and sum each award level once.
01
THE FINDING
AND ITS MEANING
The largest part of the count is at master's level.
We found 1,122 master's awards in the 2023 total, alongside 115 bachelor's awards and 53 doctorates. The certificate categories add 203 postbaccalaureate or post-master's awards and 97 below bachelor's level. There are also 26 associate degrees.
The degree label alone leaves too much out here.
We wouldn't describe the 1,616 as new undergraduate AI graduates. Master's and certificate routes may serve experienced professionals as well as new students, and the record does not say what students knew before enrolling. We'd ask who took each route before drawing a workforce conclusion.
Source records and definitions ↗What the 1,616 credentials actually are
Reported awards, CIP 11.0102, 2023
Master's
1,122
Postbaccalaureate / post-master's certificates
203
Bachelor's
115
Sub-bachelor certificates and awards
97
Doctorates
53
Associate degrees
26
Full reported counts, first majors only, each award level counted once. Degrees and certificates are separate categories; no sampling intervals.
02
THE FINDING
AND ITS MEANING
The institution record reveals what the headline hides.
Carnegie Mellon University reports 227 awards under the AI code: 45 bachelor's, 147 master's and 35 doctoral awards. Milwaukee School of Engineering reports 30, all in the postbaccalaureate or post-master's certificate category.
Both count, but they aren't the same qualification.
The records tell us the award level, not how good the teaching is or where graduates found work. We'd need different evidence for those claims.
Our state rates need the same care. IPEDS credits an award to the reporting campus, including online study. Dividing by residents shows scale, not local provision or retention.
A high rate can coexist with graduates who leave immediately and a low rate with strong local training in computer science outside CIP 11.0102.
Source records and definitions ↗Our interpretation and the next reporting questionsWhat the evidence suggests, alternative explanations, and checks not yet performed.
The educational route is the story, not just the growth curve.
Our reading of the evidence, not an additional measured result.
We'd put postgraduate study near the centre of the story. With 1,122 master's awards in the record, a report focused only on first degrees would miss most of what we've counted.
The next question is what changed inside the count.
CIP 11.0102 tracks awards under one code, not all AI teaching. A course can enter that code without being new. We'd ask colleges to explain the changes from 2020 to 2023 before calling the rise new capacity.
For Pennsylvania, the consequence is a question about people rather than awards. Did students study locally or online? Did they stay? A campus count can't establish a new local workforce, even if every award represents new teaching.
What to investigate next
Open questions for further reporting. These aren't findings or interviews we claim to have completed.
- Ask providers whether 2020 to 2023 growth means new courses, more completions, or awards moving into CIP 11.0102.
- Get enrollment and prior-work data for the 1,122 master's awards and the certificate routes. Who was already working?
- Request graduate destinations from the reporting colleges, then check AI teaching under other CIP codes before claiming a state workforce benefit.
Behind the analysis
Inspect the source records 10 records / definitions / provenance
We link every comparison to the records used. Open the provenance download to check the selected values and the source-file checksums. Interpretation stays separate from those measured results.
- Source: E1
findings.jsonSource: id: AI-01
- Source: E2
findings.jsonSource: id: AI-03
- Source: E3
tables/ai_by_level_year.csvSource: year: 2023 / level: master / CSV line 21
- Source: E4
tables/ai_by_level_year.csvSource: year: 2023 / level: postbacc_or_postmaster_cert / CSV line 23
- Source: E5
tables/ai_by_level_year.csvSource: year: 2023 / level: bachelor / CSV line 20
- Source: E6
tables/ai_by_level_year.csvSource: year: 2023 / level: sub_bachelor_certificate / CSV line 25
- Source: E7
tables/ai_by_level_year.csvSource: year: 2023 / level: doctorate / CSV line 22
- Source: E8
tables/ai_by_level_year.csvSource: year: 2023 / level: associate / CSV line 24
- Source: E9
tables/geo_institution.csvSource: unitid: 211440 / CSV line 2
- Source: E10
tables/geo_institution.csvSource: unitid: 239318 / CSV line 17
The leading places.
The defined measure.
The count rose from 389 to 1,616 awards. Programme growth and changes in how institutions code their courses can both contribute. AI study reported under other computer-science codes is outside this count.
The chart shows the leading reportable locations. Lines start at zero. Counts come from the defined administrative record.
Source: IPEDS via the Urban Institute; US Census population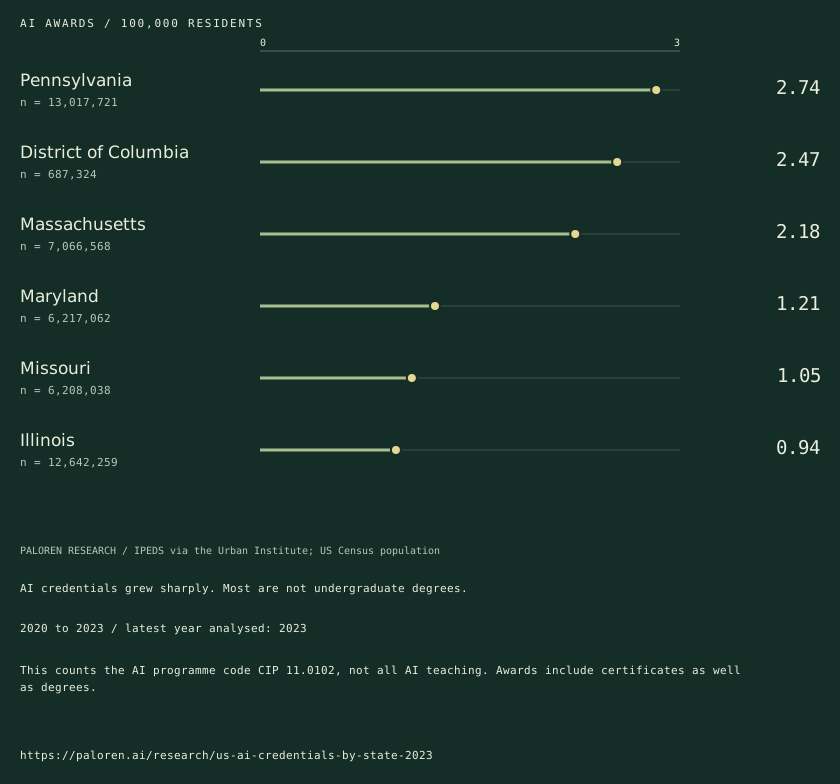
Reporter notes: explanations, unknowns and citationDownload the full briefing or inspect the sources and methods.
The finding.
The meaning.
The next question.
What qualifications sit inside the growing count of awards under the dedicated AI programme code?
Download reporter brief ↓Editorial edition / 26 October 20261,616 reported AI awards in 2023. 389 awards in 2020. Counts cover CIP 11.0102 and include degrees and certificates. Source period: 2020 to 2023 / latest year analysed: 2023.
This counts the AI programme code CIP 11.0102, not all AI teaching. Awards include certificates as well as degrees. State rows need at least one institution reporting a primary-code award in 2023. Institution rows need at least 20 awards. Counts include first majors and sum each award level once.
We'd put postgraduate study near the centre of the story. With 1,122 master's awards in the record, a report focused only on first degrees would miss most of what we've counted.
Other explanations and what we cannot answer
- More awards could reflect new courses, greater enrolment or programmes moving into the AI code.
- A reporting campus may deliver online programmes to people elsewhere, so awards per resident are not a local employment outcome.
CIP 11.0102 tracks awards under one code, not all AI teaching. A course can enter that code without being new. We'd ask colleges to explain the changes from 2020 to 2023 before calling the rise new capacity.
Where the reporting goes next
- Ask providers whether 2020 to 2023 growth means new courses, more completions, or awards moving into CIP 11.0102.
- Get enrollment and prior-work data for the 1,122 master's awards and the certificate routes. Who was already working?
- Request graduate destinations from the reporting colleges, then check AI teaching under other CIP codes before claiming a state workforce benefit.
We haven't done these checks yet. They're a route for further reporting, not extra findings.
Sources, methods and citation
No one was interviewed for this brief, and no cause was tested.
We updated this brief on 26 October 2026. We haven't refreshed the data. Use the period beside the finding.
Copyable citation
Paloren Research. AI credentials grew. What kind of training grew with them?. Editorial edition 26 October 2026. https://paloren.ai/research/us-ai-credentials-by-state-2023
Use our analysis with credit to Paloren Research and a link. Don't drop the caveats. We can't grant rights to a source publisher's material.
Request comment or a correction ↗Method and limitationsDefinitions, exclusions, source records and the checks behind this edition.
What this can
and cannot say.
State rows need at least one institution reporting a primary-code award in 2023. Institution rows need at least 20 awards. Counts include first majors and sum each award level once.
Open the primary source ↗- 01
We count IPEDS awards, not a sample of students. No confidence intervals apply. The AI code is CIP 11.0102; we don't count AI teaching reported under other computer-science codes.
- 02
A campus address isn't a student's home. These rates don't show who stays to work.
- 03
We analysed through 2023. The 2024 API request failed twice, which isn't proof that no 2024 data exists elsewhere. We've left the secondary programme-code series out because its full code titles still need checking.
Leave with the record.
Keep the definition, period and qualification with any figure you reuse. The download includes the local facts supplied by the study, source-row references and reporting rules.
Request comment or a source check ↗How to read
our research.
Original analysis, with the evidence and its limits kept together.
Publisher and methods
We're part of Paloren, an AI consultancy and commercial publisher. We don't claim to be an independent research institution.
We show what we counted, then explain our reading of it. They're different. An AI name isn't proof of an AI business; a filing's warning isn't an incident report.
Corrections and version history 26 October 2026
We changed the articles on 26 October 2026, not the source data. Edition newsroom-20261026.
- Names and number formatting / 28 October 2026 / Local copy corrections
UK company totals now use thousands separators in local facts. H-1B state names are written out, and the credentials study uses the correct singular or plural for reporting institutions. The figures haven't changed.
- Copy edit / 28 October 2026 / Research copy notes
We made copy edits for clarity and consistency. Methods, findings and figures have not changed.
- Reading and presentation update / All ten studies
The opening links to the downloadable briefing. Local tables come first. You can expand secondary detail or print the study, keeping the source notes and caveats beside the results so they don't get lost when you share a finding. Source values are unchanged. We also corrected punctuation and displayed council-record grammar.
- Editorial update / All ten studies
Each of the ten studies now has a brief. It sets out what we found, our take, and what we'd need to check next. The datasets haven't been refreshed.
We keep each source period beside its finding. We haven't set a schedule for new data releases.
Reuse and corrections
Use our original charts and analysis with credit to Paloren Research and a link. Keep the source period and caveats. We can't grant rights to material owned by a source publisher.
Found a mistake? Send us the page and the record we should check at aaron@palorenresearch.com.
For a quote from Aaron, please ask for a current comment. Our labelled analysis isn't a spoken quotation.
Infrastructure / United StatesThe hosting boom is bigger than the data-centre count.↗Work / United StatesThe same jobs. A different AI exposure ranking.↗Company registers / United KingdomLondon has an AI-name cluster. It is not yet an industry map.↗
All local investigations ↗Research
Local investigations
Media
Paloren

A finding is a starting point. Bring it to Paloren and we will test what it means for your business.
Talk to Paloren