

THE PUBLIC RECORD / PALORENFIELD NOTES / 16
A USAspending search finds $21.76bn in obligations whose descriptions name AI work. Blind-coding the awards produces an estimated $16.68bn for actual AI work, with a 90% interval of $15.55bn to $17.76bn.
$16.68bn
estimated federal obligations for AI work
90% interval: $15.55bn to $17.76bn. Precision review: n = 200 awards.FY2020 to FY2026, as loaded 24 October 2026READ THIS WITH THE NUMBER
Obligations are commitments, not money spent. These are estimated, precision-adjusted figures; FY2026 may still be incomplete.
Analysis by
Paloren Research
What we set out to find.
We searched federal award descriptions for AI work. Then we checked the search against a blind review of 200 awards, adjusted the totals by agency group and compared estimated obligations across 52 locations. How much survives that relevance check?
What we found
The adjusted estimate is $16.68bn in federal obligations for AI work in FY2020 to FY2026, with a 90% interval of $15.55bn to $17.76bn. Only 76.0% of the reviewed keyword matches were classified as AI work.
How we did it, and what it cannot tell us ↗Find your place.
Take the evidence.
We've made 52 reportable locations searchable. Start with a name. We keep the count and caveat beside each finding so you can check what you're quoting. A missing place isn't a zero.
States, DC and Puerto Rico
| Rank | Place | Estimated obligations / resident | Matched awards (n) | 90% precision interval |
|---|---|---|---|---|
| 1 | District of Columbia | $524.65 | 371 | $485.13 to $562.29 |
| 2 | Massachusetts | $191.56 | 1,756 | $176.41 to $206.1 |
| 3 | Virginia | $127.83 | 1,009 | $119.03 to $135.79 |
| 4 | Maryland | $114.81 | 934 | $108.5 to $121.03 |
| 5 | Rhode Island | $84.15 | 219 | $78.26 to $89.83 |
| 6 | Delaware | $70.91 | 129 | $65.6 to $76.02 |
| 7 | Pennsylvania | $66.52 | 1,401 | $61.02 to $71.69 |
| 8 | North Carolina | $60.73 | 797 | $55.72 to $65.69 |
| 9 | California | $59.87 | 3,238 | $55.25 to $64.27 |
| 10 | North Dakota | $56.88 | 39 | $52.42 to $61.34 |
| 11 | New Hampshire | $54.28 | 105 | $50.42 to $58.14 |
| 12 | New York | $54.01 | 1,753 | $49.32 to $58.43 |
| 13 | Connecticut | $49.48 | 337 | $44.71 to $54.03 |
| 14 | Illinois | $47.88 | 877 | $44.3 to $51.43 |
| 15 | Washington | $47.04 | 486 | $43.07 to $50.92 |
| 16 | Colorado | $44.95 | 496 | $42.03 to $47.8 |
| 17 | South Dakota | $44.83 | 76 | $41.59 to $47.99 |
| 18 | Oregon | $44.59 | 247 | $40.8 to $48.24 |
| 19 | Alabama | $42.44 | 308 | $39.29 to $45.42 |
| 20 | Tennessee | $42.28 | 416 | $38.6 to $45.85 |
| 21 | Hawaii | $40.41 | 89 | $37.55 to $43.09 |
| 22 | West Virginia | $40.27 | 78 | $37.58 to $42.78 |
| 23 | Michigan | $39.3 | 715 | $36.38 to $42.19 |
| 24 | Texas | $38.61 | 1,497 | $35.94 to $41.23 |
| 25 | Indiana | $38.36 | 546 | $35.7 to $40.96 |
| 26 | Wisconsin | $37.48 | 357 | $34.67 to $40.25 |
| 27 | Georgia | $36.52 | 697 | $34.1 to $38.94 |
| 28 | Maine | $35.33 | 56 | $31.65 to $38.71 |
| 29 | Iowa | $35.14 | 230 | $32.54 to $37.68 |
| 30 | Vermont | $35.02 | 42 | $32.37 to $37.63 |
| 31 | Minnesota | $33.33 | 303 | $30.16 to $36.34 |
| 32 | Alaska | $32.64 | 30 | $30.52 to $34.78 |
| 33 | Ohio | $32.43 | 561 | $30.4 to $34.38 |
| 34 | Arizona | $32.39 | 428 | $30.09 to $34.59 |
| 35 | Oklahoma | $31.89 | 153 | $29.33 to $34.33 |
| 36 | Montana | $31.54 | 42 | $28.96 to $34.16 |
| 37 | Utah | $31.35 | 241 | $28.83 to $33.78 |
| 38 | New Mexico | $30.87 | 139 | $29.08 to $32.65 |
| 39 | Missouri | $28.03 | 340 | $25.95 to $30.02 |
| 40 | Mississippi | $27.23 | 98 | $25.32 to $28.97 |
| 41 | New Jersey | $25.95 | 535 | $24.47 to $27.4 |
| 42 | Nebraska | $25.88 | 101 | $23.88 to $27.8 |
| 43 | South Carolina | $22.72 | 232 | $21.05 to $24.37 |
| 44 | Florida | $22.68 | 897 | $21.08 to $24.26 |
| 45 | Louisiana | $22.5 | 177 | $21.07 to $23.86 |
| 46 | Idaho | $22 | 79 | $20.16 to $23.85 |
| 47 | Nevada | $21.03 | 81 | $19.39 to $22.67 |
| 48 | Kentucky | $19.39 | 132 | $17.61 to $21.07 |
| 49 | Kansas | $18.49 | 96 | $17.08 to $19.9 |
| 50 | Wyoming | $16.32 | 27 | $15.27 to $17.36 |
| 51 | Arkansas | $13.24 | 78 | $12.26 to $14.19 |
| 52 | Puerto Rico | $9.14 | 45 | $8.37 to $9.94 |
No reportable match. Try a shorter name or switch geography.
We require at least 25 matched awards per location. Ranks use adjusted obligations per resident. We adjust each agency group on its own, using the precision measured in blind review.
01
THE FINDING
AND ITS MEANING
The error rate depends on which awards you read.
The NSF sample contains 75 AI-work awards out of 105 matches. HHS contains 37 out of 51. All 22 sampled Defense awards were classified as AI work; other agencies contain 18 out of 22.
A single adjustment would erase those differences.
Every place has its own award mix. We adjust each agency group's dollars with its own precision rate, so multiplying every state's total by 76.0% won't reproduce the estimates.
Defense warrants particular care. All 22 sampled matches passed review, but the sample is small. We keep the Wilson interval beside the score rather than treating 100.0% as a guarantee for the stratum.
A separate recall issue remains: awards indexed outside the keyword filter, or described without those AI terms, aren't in the frame at all. The adjustment corrects overclassification in matched awards. It doesn't create a complete federal AI inventory.
Source records and definitions ↗How often the matched description was AI work
% confirmed in each agency-group sample
NSF
71.4%
Source: 75 of 105 sampled awards; Wilson 95% interval 62.2 to 79.2%.
HHS
72.5%
Source: 37 of 51 sampled awards; Wilson 95% interval 59.1 to 82.9%.
DoD
100.0%
Source: 22 of 22 sampled awards; Wilson 95% interval 85.1 to 100%.
Other agencies
81.8%
Source: 18 of 22 sampled awards; Wilson 95% interval 61.5 to 92.7%.
Source: adjudicated validation sample, 200 awards in total. These 95% intervals describe classification precision; the 90% dollar intervals come from a separate bootstrap.
02
THE FINDING
AND ITS MEANING
A per-resident lead is not a cheque to the local economy.
The District of Columbia has estimated obligations of $524.65 per resident, with a 90% interval of $485.13 to $562.29, across 371 matched awards. Massachusetts has $191.56, with an interval of $176.41 to $206.1, across 1,756 matched awards.
Nobody in DC receives a payment for each resident. We haven't measured cash paid to local recipients.
We assign obligations by place of performance. We then divide that window's total by the population measure. This isn't annual spending per person. The recipient needn't be headquartered there.
We'd trace DC's high result back to its projects. A few large awards can drive a total. That doesn't show broad prosperity, employment, or AI use. The recipient's headquarters may sit elsewhere. Place of performance is an administrative field.
Source records and definitions ↗Our interpretation and the next reporting questionsWhat the evidence suggests, alternative explanations, and checks not yet performed.
Read the funding description before writing the funding headline.
Our reading of the evidence, not an additional measured result.
We'd make the checking part of the story. A search for AI language found $21.76bn in obligations, but reading a blind-coded sample of descriptions changed what we could responsibly call AI work.
An estimate still leaves individual awards to check.
Our $16.68bn estimate uses the 200-award sample to adjust the total. The 90% interval covers sampling error in those precision rates. It doesn't cover missed awards, search-index gaps, coding disputes or whether the work was delivered. We'd still read each large award before reporting on it.
Consequences matter. Calling the raw total an AI budget exaggerates federal effort. Calling an obligation a payment exaggerates money received. Both mistakes can distort a local funding story.
What to investigate next
Open questions for further reporting. These aren't findings or interviews we claim to have completed.
- Read the 3 largest awards in a state. Ask the funding agency which parts involve AI and when the work is due.
- Compare the recorded work location with the award holder's address and any subcontractors. Where did the work happen?
- Follow the USAspending transactions and outlays. Don't count a commitment as cash received.
Behind the analysis
Inspect the source records 8 records / definitions / provenance
We link every comparison to the records used. Open the provenance download to check the selected values and the source-file checksums. Interpretation stays separate from those measured results.
- Source: E1
findings.jsonSource: id: AI-01
- Source: E2
findings.jsonSource: id: AI-ADJ-01
- Source: E3
tables/precision_by_stratum.csvSource: stratum: NSF / CSV line 2
- Source: E4
tables/precision_by_stratum.csvSource: stratum: HHS / CSV line 3
- Source: E5
tables/precision_by_stratum.csvSource: stratum: DoD / CSV line 4
- Source: E6
tables/precision_by_stratum.csvSource: stratum: Other / CSV line 5
- Source: E7
tables/geo_state_adjusted.csvSource: location_code: DC / CSV line 2
- Source: E8
tables/geo_state_adjusted.csvSource: location_code: MA / CSV line 3
The leading places.
The defined measure.
The raw keyword total is $21.76bn in awards whose descriptions name AI work. Blind review found that 76.0% of matched awards were actually AI work. Adjustment by agency group produces the estimated total reported here.
Dots show the reported value. Lines show the 90% precision interval. A rank isn't a test of differences.
Source: USAspending and US Census population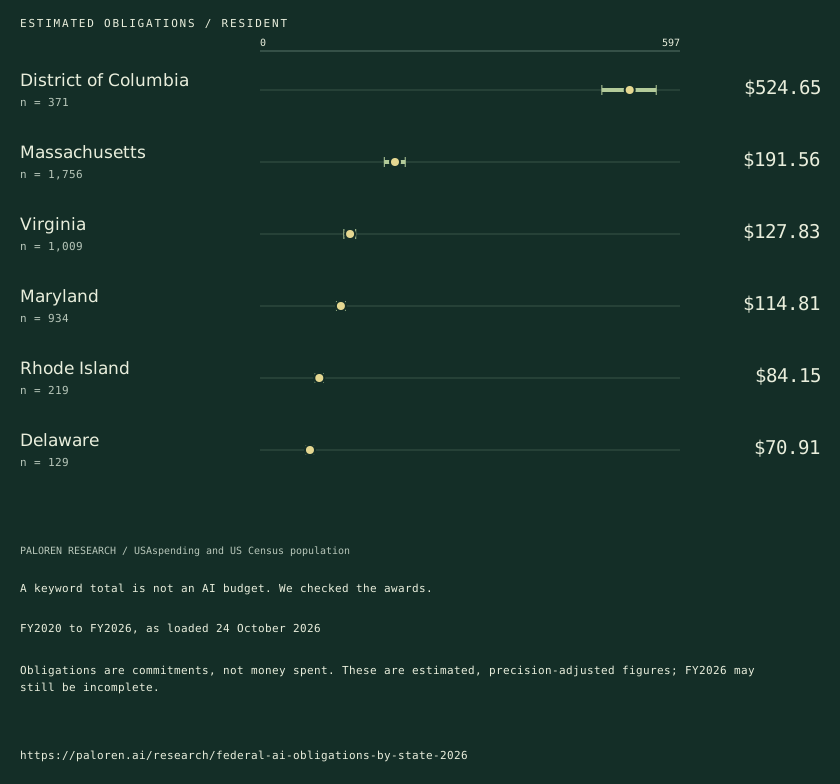
Reporter notes: explanations, unknowns and citationDownload the full briefing or inspect the sources and methods.
The finding.
The meaning.
The next question.
How much of the keyword-matched federal funding record is actually described as AI work?
Download reporter brief ↓Editorial edition / 26 October 2026$16.68bn estimated federal obligations for AI work. 90% interval: $15.55bn to $17.76bn. Precision review: n = 200 awards. Source period: FY2020 to FY2026, as loaded 24 October 2026.
Obligations are commitments, not money spent. These are estimated, precision-adjusted figures; FY2026 may still be incomplete. We require at least 25 matched awards per location. Ranks use adjusted obligations per resident. We adjust each agency group on its own, using the precision measured in blind review.
We'd make the checking part of the story. A search for AI language found $21.76bn in obligations, but reading a blind-coded sample of descriptions changed what we could responsibly call AI work.
Other explanations and what we cannot answer
- The keyword filter admits incidental mentions and misses work described without the selected terms.
- A few large awards or administrative performance locations can shape a local total without broad local employment.
Our $16.68bn estimate uses the 200-award sample to adjust the total. The 90% interval covers sampling error in those precision rates. It doesn't cover missed awards, search-index gaps, coding disputes or whether the work was delivered. We'd still read each large award before reporting on it.
Where the reporting goes next
- Read the 3 largest awards in a state. Ask the funding agency which parts involve AI and when the work is due.
- Compare the recorded work location with the award holder's address and any subcontractors. Where did the work happen?
- Follow the USAspending transactions and outlays. Don't count a commitment as cash received.
We haven't done these checks yet. They're a route for further reporting, not extra findings.
Sources, methods and citation
No one was interviewed for this brief, and no cause was tested.
We updated this brief on 26 October 2026. We haven't refreshed the data. Use the period beside the finding.
Copyable citation
Paloren Research. How much federal funding is actually for AI work?. Editorial edition 26 October 2026. https://paloren.ai/research/federal-ai-obligations-by-state-2026
Use our analysis with credit to Paloren Research and a link. Don't drop the caveats. We can't grant rights to a source publisher's material.
Request comment or a correction ↗Method and limitationsDefinitions, exclusions, source records and the checks behind this edition.
What this can
and cannot say.
We require at least 25 matched awards per location. Ranks use adjusted obligations per resident. We adjust each agency group on its own, using the precision measured in blind review.
Open the primary source ↗- 01
We estimate precision from 200 coded awards. The 90% range shows how that sample affects the adjusted total; it doesn't cover every coding mistake or missing award. We can't treat it as a guarantee about the true total.
- 02
We use place of performance. That isn't necessarily the recipient's home state.
- 03
FY2025 and FY2026 use 2024 population. Our 52 locations include DC and Puerto Rico as well as the states. Close ranks aren't proof of a real difference; we haven't adjusted for multiple comparisons.
Leave with the record.
Keep the definition, period and qualification with any figure you reuse. The download includes the local facts supplied by the study, source-row references and reporting rules.
Request comment or a source check ↗How to read
our research.
Original analysis, with the evidence and its limits kept together.
Publisher and methods
We're part of Paloren, an AI consultancy and commercial publisher. We don't claim to be an independent research institution.
We show what we counted, then explain our reading of it. They're different. An AI name isn't proof of an AI business; a filing's warning isn't an incident report.
Corrections and version history 26 October 2026
We changed the articles on 26 October 2026, not the source data. Edition newsroom-20261026.
- Copy edit / 28 October 2026 / Research copy notes
We made copy edits for clarity and consistency. Methods, findings and figures have not changed.
- Commitments and geography / 28 October 2026 / Federal AI obligations
The 52 local facts now describe federal commitments, not money received. Geography labels include states, DC and Puerto Rico. No amounts or ranks changed.
- Reading and presentation update / All ten studies
The opening links to the downloadable briefing. Local tables come first. You can expand secondary detail or print the study, keeping the source notes and caveats beside the results so they don't get lost when you share a finding. Source values are unchanged. We also corrected punctuation and displayed council-record grammar.
- Editorial update / All ten studies
Each of the ten studies now has a brief. It sets out what we found, our take, and what we'd need to check next. The datasets haven't been refreshed.
We keep each source period beside its finding. We haven't set a schedule for new data releases.
Reuse and corrections
Use our original charts and analysis with credit to Paloren Research and a link. Keep the source period and caveats. We can't grant rights to material owned by a source publisher.
Found a mistake? Send us the page and the record we should check at aaron@palorenresearch.com.
For a quote from Aaron, please ask for a current comment. Our labelled analysis isn't a spoken quotation.
Infrastructure / United StatesThe hosting boom is bigger than the data-centre count.↗Work / United StatesThe same jobs. A different AI exposure ranking.↗Company registers / United KingdomLondon has an AI-name cluster. It is not yet an industry map.↗
All local investigations ↗Research
Local investigations
Media
Paloren

A finding is a starting point. Bring it to Paloren and we will test what it means for your business.
Talk to Paloren