

THE PUBLIC RECORD / PALORENFIELD NOTES / 13
The median offered-wage gap between AI-titled and software H-1B filings is 22.1% nationally. Houston and Charlotte show why an individual employer, role mix and local market can produce a very different result.
$170,000
median annual offered wage on AI-titled H-1B filings
n = 13,302 filings. Middle 50% of offers: $131,086 to $210,000 (IQR).October 2024 to June 2026READ THIS WITH THE NUMBER
These are offered wages on employer-sponsored H-1B filings, not all AI jobs. They aren't paid wages or total compensation.
Analysis by
Paloren Research
What we set out to find.
We analysed offered wages on 13,302 AI-titled H-1B filings from October 2024 to June 2026. Does the national pay gap hold up locally? A comparison with software-developer filings across 23 reportable cities lets us check.
What we found
The median AI-titled offer was $170,000, 22.1% above the software-developer filing median. But look at the cities. Houston has a larger local premium than San Francisco, yet a lower AI offer. In Charlotte, the AI median is below the software median.
How we did it, and what it cannot tell us ↗Find your place.
Take the evidence.
We've made 23 reportable cities searchable. Start with a name. We keep the count and caveat beside each finding so you can check what you're quoting. A missing place isn't a zero.
Cities
| Rank | Place | Median H-1B offered wage / year | AI-titled H-1B filings (n) | Middle 50% of offers (IQR) |
|---|---|---|---|---|
| 1 | MENLO PARK, CA | $214,228 | 225 | $189,982 to $238,300 |
| 2 | MOUNTAIN VIEW, CA | $210,000 | 344 | $184,557 to $238,111 |
| 3 | SAN MATEO, CA | $210,000 | 146 | $177,135 to $260,080 |
| 4 | SAN JOSE, CA | $209,000 | 1,065 | $172,336 to $260,000 |
| 5 | PALO ALTO, CA | $207,000 | 532 | $172,931 to $250,000 |
| 6 | SAN FRANCISCO, CA | $205,000 | 886 | $170,591 to $234,273 |
| 7 | CUPERTINO, CA | $203,386 | 430 | $180,346 to $226,158 |
| 8 | SANTA CLARA, CA | $199,534 | 375 | $171,918 to $226,158 |
| 9 | BELLEVUE, WA | $194,250 | 374 | $150,987 to $235,000 |
| 10 | SUNNYVALE, CA | $193,978 | 616 | $174,304 to $225,077 |
| 11 | SEATTLE, WA | $183,581 | 535 | $161,500 to $212,202 |
| 12 | NEW YORK, NY | $179,982 | 905 | $148,822 to $210,000 |
| 13 | JERSEY CITY, NJ | $160,805 | 140 | $140,000 to $191,900 |
| 14 | BOSTON, MA | $159,055 | 230 | $132,429 to $185,000 |
| 15 | SAN DIEGO, CA | $150,500 | 235 | $130,187 to $169,000 |
| 16 | AUSTIN, TX | $140,800 | 296 | $116,272 to $163,550 |
| 17 | CHICAGO, IL | $135,915 | 173 | $108,077 to $165,000 |
| 18 | DALLAS, TX | $130,000 | 136 | $112,242 to $156,998 |
| 19 | PLANO, TX | $130,000 | 190 | $105,997 to $166,812 |
| 20 | ATLANTA, GA | $124,266 | 152 | $96,816 to $155,166 |
| 21 | HOUSTON, TX | $120,640 | 101 | $100,500 to $145,000 |
| 22 | IRVING, TX | $119,999 | 133 | $96,034 to $156,600 |
| 23 | CHARLOTTE, NC | $117,418 | 108 | $112,424 to $160,000 |
States
| Rank | Place | Median H-1B offered wage / year | AI-titled H-1B filings (n) | Middle 50% of offers (IQR) |
|---|---|---|---|---|
| 1 | CA | $195,978 | 5,903 | $165,000 to $228,970 |
| 2 | WA | $188,942 | 1,066 | $153,334 to $212,202 |
| 3 | NY | $174,701 | 1,109 | $145,000 to $207,800 |
| 4 | MA | $154,606 | 568 | $128,387 to $181,500 |
| 5 | NJ | $151,000 | 474 | $123,656 to $183,875 |
| 6 | IL | $132,434 | 337 | $106,558 to $162,000 |
| 7 | PA | $130,345 | 241 | $105,206 to $160,000 |
| 8 | VA | $130,000 | 171 | $104,042 to $170,825 |
| 9 | TX | $128,960 | 1,309 | $105,976 to $157,019 |
| 10 | NC | $126,700 | 275 | $112,424 to $157,248 |
| 11 | MI | $125,000 | 162 | $102,190 to $144,399 |
| 12 | GA | $122,092 | 322 | $98,387 to $152,131 |
| 13 | FL | $119,176 | 198 | $99,195 to $150,000 |
| 14 | OH | $117,000 | 109 | $95,000 to $155,000 |
| 15 | AZ | $115,710 | 118 | $100,000 to $145,428 |
No reportable match. Try a shorter name or switch geography.
At least 100 AI-titled filings per place. A software comparison is reportable only when both groups have at least 100 filings. Ranks use the median offered wage on H-1B filings.
01
THE FINDING
AND ITS MEANING
Houston has the larger local premium. San Francisco has the higher offer.
Houston's AI-titled H-1B median offered wage is $120,640 across 101 filings, with a middle 50% range of $100,500 to $145,000. Its software-filing median is $106,000 across 3,171 filings, giving a 13.8% local premium.
San Francisco's AI-titled H-1B median is $205,000 across 886 filings, with a middle 50% range of $170,591 to $234,273. Its software median is $195,000 across 7,011 filings, so the local premium is 5.1%.
We'd keep the comparator in the story.
Houston's larger gap doesn't make its offered wages higher. San Francisco starts with a much higher software median. A larger percentage can therefore coexist with a lower absolute offer.
The two measures support different stories: one asks how much AI-titled filings beat local software offers; the other asks what workers are offered.
Source records and definitions ↗Higher offered pay, smaller local gap
HOUSTON, TX
AI-titled H-1B median offered wage$120,640
Software H-1B median offered wage$106,000
Source: AI n = 101, IQR $100,500 to $145,000; software n = 3,171. Local gap: 13.8%.
SAN FRANCISCO, CA
AI-titled H-1B median offered wage$205,000
Software H-1B median offered wage$195,000
Source: AI n = 886, IQR $170,591 to $234,273; software n = 7,011. Local gap: 5.1%.
CHARLOTTE, NC
AI-titled H-1B median offered wage$117,418
Software H-1B median offered wage$130,000
Source: AI n = 108, IQR $112,424 to $160,000; software n = 5,427. Local gap: -9.7%.
Both columns use the same dollar scale. October 2024 to June 2026. Offered wages on H-1B filings, not all AI jobs, paid wages or total compensation. IQR describes spread, not confidence.
02
THE FINDING
AND ITS MEANING
Charlotte is a counterexample to the automatic-premium story.
Charlotte's AI-titled H-1B median offered wage is $117,418 across 108 filings, with an IQR of $112,424 to $160,000. The software median is $130,000 across 5,427 filings. The reported local gap is -9.7%.
We aren't saying AI skills reduce pay.
Charlotte's gap could come from smaller samples, different employers, different role levels, or industries with different pay structures. We haven't matched equivalent roles, experience levels or employers, so we can't separate those effects.
A median also hides the distribution; the IQR is there for that reason.
The counterexample still matters. If we turn the national premium into a promise to every worker, Charlotte's filing record immediately challenges it. That is a reason for better questions, not career advice based on two city medians.
Source records and definitions ↗Our interpretation and the next reporting questionsWhat the evidence suggests, alternative explanations, and checks not yet performed.
Use the filings to question a salary claim.
Our reading of the evidence, not an additional measured result.
We'd use these filings to challenge a broad salary claim. Houston's premium and Charlotte's discount are concrete reasons to ask which roles an employer is comparing. The records show what sponsors offered through the H-1B channel, not what every AI worker earns.
They don't show the value of a skill in isolation.
To make a causal claim, we'd need comparable roles at similar levels, with employer, location, experience and time accounted for. Offered wages also exclude equity, bonuses, eventual raises and non-sponsored roles. The national 22.1% gap can't stand in for that analysis.
The consequence of over-reading is easy to state: a person may expect a national uplift that does not exist in a particular job market, or an employer may use the aggregate to justify a local offer without looking at comparable roles.
What to investigate next
Open questions for further reporting. These aren't findings or interviews we claim to have completed.
- Match AI-titled and software filings on SOC, seniority, employer, worksite and filing year, then compare the distributions.
- Ask employers to separate base salary from bonuses, equity and expected hours, and keep H-1B offered wages separate from paid wages.
- Check whether Charlotte's gap disappears after matching; if it does not, investigate the city's employer mix instead of assuming a local AI discount.
Behind the analysis
Inspect the source records 5 records / definitions / provenance
We link every comparison to the records used. Open the provenance download to check the selected values and the source-file checksums. Interpretation stays separate from those measured results.
- Source: E1
findings.jsonSource: id: H1
- Source: E2
findings.jsonSource: id: H2
- Source: E3
tables/geo_city.csvSource: location: HOUSTON, TX / CSV line 683
- Source: E4
tables/geo_city.csvSource: location: CHARLOTTE, NC / CSV line 715
- Source: E5
tables/geo_city.csvSource: location: SAN FRANCISCO, CA / CSV line 104
The leading places.
The defined measure.
The median AI-titled H-1B offer is 22.1% above the software-developer filing median of $139,214 (n = 289,212). That comparator includes AI-titled software-developer filings, so the groups overlap.
Dots show the reported value. Lines show the middle 50% of offers (iqr). A rank isn't a test of differences.
Source: US Department of Labor LCA disclosures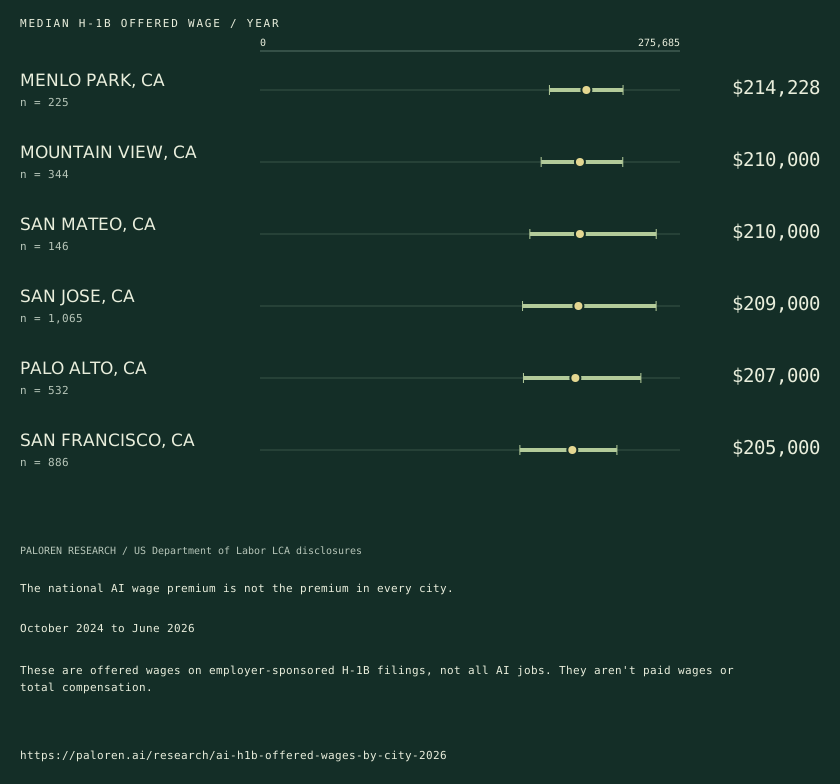
Reporter notes: explanations, unknowns and citationDownload the full briefing or inspect the sources and methods.
The finding.
The meaning.
The next question.
Does the national offered-wage gap on AI-titled H-1B filings hold in individual cities?
Download reporter brief ↓Editorial edition / 26 October 2026$170,000 median annual offered wage on AI-titled H-1B filings. n = 13,302 filings. Middle 50% of offers: $131,086 to $210,000 (IQR). Source period: October 2024 to June 2026.
These are offered wages on employer-sponsored H-1B filings, not all AI jobs. They aren't paid wages or total compensation. At least 100 AI-titled filings per place. A software comparison is reportable only when both groups have at least 100 filings. Ranks use the median offered wage on H-1B filings.
We'd use these filings to challenge a broad salary claim. Houston's premium and Charlotte's discount are concrete reasons to ask which roles an employer is comparing. The records show what sponsors offered through the H-1B channel, not what every AI worker earns.
Other explanations and what we cannot answer
- Employer mix, location, seniority and sponsored-role selection can explain a gap without a causal return to AI skills.
- The software comparator overlaps the AI-titled group; neither group describes all workers.
To make a causal claim, we'd need comparable roles at similar levels, with employer, location, experience and time accounted for. Offered wages also exclude equity, bonuses, eventual raises and non-sponsored roles. The national 22.1% gap can't stand in for that analysis.
Where the reporting goes next
- Match AI-titled and software filings on SOC, seniority, employer, worksite and filing year, then compare the distributions.
- Ask employers to separate base salary from bonuses, equity and expected hours, and keep H-1B offered wages separate from paid wages.
- Check whether Charlotte's gap disappears after matching; if it does not, investigate the city's employer mix instead of assuming a local AI discount.
We haven't done these checks yet. They're a route for further reporting, not extra findings.
Sources, methods and citation
No one was interviewed for this brief, and no cause was tested.
We updated this brief on 26 October 2026. We haven't refreshed the data. Use the period beside the finding.
Copyable citation
Paloren Research. The AI wage premium changes from city to city.. Editorial edition 26 October 2026. https://paloren.ai/research/ai-h1b-offered-wages-by-city-2026
Use our analysis with credit to Paloren Research and a link. Don't drop the caveats. We can't grant rights to a source publisher's material.
Request comment or a correction ↗Method and limitationsDefinitions, exclusions, source records and the checks behind this edition.
What this can
and cannot say.
At least 100 AI-titled filings per place. A software comparison is reportable only when both groups have at least 100 filings. Ranks use the median offered wage on H-1B filings.
Open the primary source ↗- 01
We keep certified H-1B filings and convert the offered minimum rate to a yearly figure. We don't know what a worker was eventually paid. Nor can we use these filings to describe all US AI jobs.
- 02
The range is the middle half of offers. It isn't a confidence interval.
- 03
Our title rule has about 92.5% precision on blind review. Some AI-labelled roles aren't AI engineering work. FY2026 is partial here: we have October 2025 to June 2026, not the full year.
Leave with the record.
Keep the definition, period and qualification with any figure you reuse. The download includes the local facts supplied by the study, source-row references and reporting rules.
Request comment or a source check ↗How to read
our research.
Original analysis, with the evidence and its limits kept together.
Publisher and methods
We're part of Paloren, an AI consultancy and commercial publisher. We don't claim to be an independent research institution.
We show what we counted, then explain our reading of it. They're different. An AI name isn't proof of an AI business; a filing's warning isn't an incident report.
Corrections and version history 26 October 2026
We changed the articles on 26 October 2026, not the source data. Edition newsroom-20261026.
- Names and number formatting / 28 October 2026 / Local copy corrections
UK company totals now use thousands separators in local facts. H-1B state names are written out, and the credentials study uses the correct singular or plural for reporting institutions. The figures haven't changed.
- Copy edit / 28 October 2026 / Research copy notes
We made copy edits for clarity and consistency. Methods, findings and figures have not changed.
- Reading and presentation update / All ten studies
The opening links to the downloadable briefing. Local tables come first. You can expand secondary detail or print the study, keeping the source notes and caveats beside the results so they don't get lost when you share a finding. Source values are unchanged. We also corrected punctuation and displayed council-record grammar.
- Editorial update / All ten studies
Each of the ten studies now has a brief. It sets out what we found, our take, and what we'd need to check next. The datasets haven't been refreshed.
We keep each source period beside its finding. We haven't set a schedule for new data releases.
Reuse and corrections
Use our original charts and analysis with credit to Paloren Research and a link. Keep the source period and caveats. We can't grant rights to material owned by a source publisher.
Found a mistake? Send us the page and the record we should check at aaron@palorenresearch.com.
For a quote from Aaron, please ask for a current comment. Our labelled analysis isn't a spoken quotation.
Infrastructure / United StatesThe hosting boom is bigger than the data-centre count.↗Work / United StatesThe same jobs. A different AI exposure ranking.↗Company registers / United KingdomLondon has an AI-name cluster. It is not yet an industry map.↗
All local investigations ↗Research
Local investigations
Media
Paloren

A finding is a starting point. Bring it to Paloren and we will test what it means for your business.
Talk to Paloren